IT development teams have long been searching for a magic formula of success in software development. How can teams find the greatest efficiency and the least cost, without sacrificing quality?
Teams have tried a myriad of methodologies to achieve these goals. Twenty years ago, developers looked to waterfall software development as the answer. Waterfall then gave rise to object-oriented incremental or spiral, Rational Unified Development (RUP) practices.
Today, it’s all about agile development. Companies are investing lots of capital to develop agile methodologies and committing significant resources to train employees to work within agile frameworks.
Despite this investment in agile methodologies, many software projects still fail, clients are unsatisfied, and IT departments often miss deadlines. Why?
The method doesn't matter. It's all about planning and how teams use resources.
When software projects get behind schedule, team leaders almost automatically think that adding more staff will help. After all, many hands make light work, right? The more staff a team has working on a project, the faster and shorter development time needed.
The old adage doesn't necessarily apply in software development. In fact, the opposite effect can occur: adding more people to a project can make more work or even slow things down further. The additional person-hours may give the team a short-term boost, but over time, the team will have to manage higher costs and more connection points—each of which creates an opportunity for a mistake or defect, bringing additional risk to the project.
What's more, how teams allocate resources is just as important, if not more, to successful projects as which development method teams use. While methods have changed, the allocation of resources has remained paramount over the last two decades. This finding was underscored in QSM's latest analysis, which leveraged data from the most recent QSM Software Project Database update. The update includes new insights into agile development processes and the staffing models that agile teams are employing for their projects.
The following table provides a glimpse into how adding staff affects a project's outcome. It compares 390 applications of the same size featuring both 10,000 and 20,000 lines of newly developed code, with a significant portion using agile methods and tools. One sample uses an average of less than four people; the other, nine people or more. While the additional staff reduced the schedule by approximately 30 percent, the project cost actually increased by 350 percent. The additional staff also created 500 percent more defects that had to be fixed during testing.

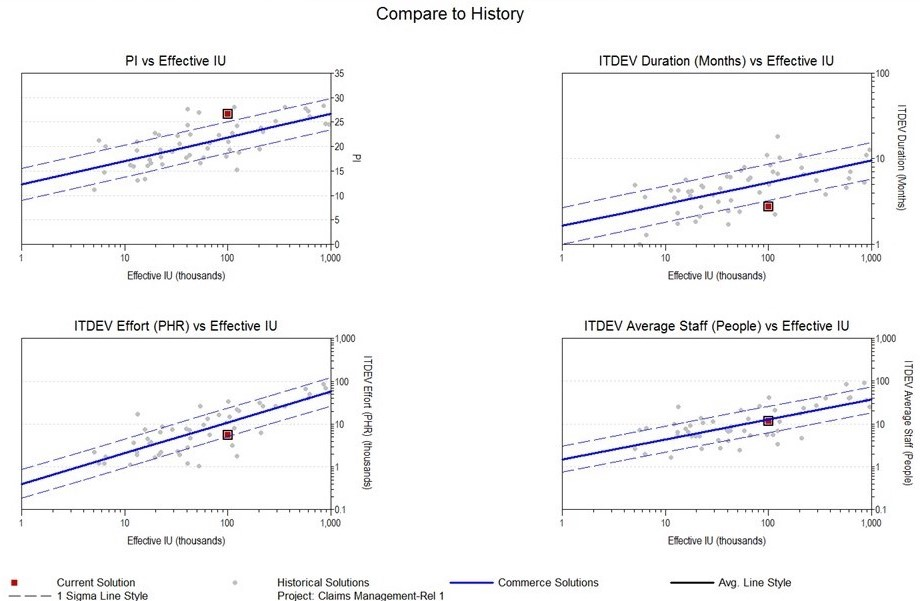
In the graphs below, the lines represent the average behavior for size developed vs. schedule, effort, defect, and average staffing. Notice the large variation in effort and defects and small variations in schedule.

Over the past 15 years, QSM has performed this same study in five-year increments and has found the same results -- staffing decisions have more of an impact on project success than any development methodology.
Instead of relying on a particular development method, project managers should estimate early and use predictive analysis to staff their projects. Predictive analysis and early software estimation can help C-suite executives more accurately plan for staffing as well as set projects and developers up for success. These techniques provide an accurate sense of how many people should be assigned to a project. Additionally, executives who use them gain actionable insights that help with course correction throughout a given project’s lifecycle.
Individual projects may differ, but all projects can benefit from a step-by-step process that uses predictive analysis and early software estimation to more accurately account for staffing needs.
1. Gather all current project data in one place.
It's important to know the status of current resources before beginning a new project. Creating a central place that allows team leaders to see all project data at-a-glance – including start and end dates, resources currently deployed, and so forth – can provide a snapshot of how many resources are currently available to work on a given project and where that project fits into an organization's overall development cycle.
Software lifecycle management solutions provide the tools through which team leaders can monitor projects that are in various stages of development. These tools store data about each project an organization completes and allow users to generate subsequently more accurate forecasts with each project entered and tracked.
2. Examine historical data.
Once team leaders have current project data in place, they should run a forecasting analysis to see if they have the right number of resources available to complete a project in the timeframe proposed. A forecasting analysis is based on historical data from past projects that were similar in scope and size. Data from these past projects give a good idea of how many resources may be needed to complete the project within the budget and time allotted.
Unfortunately, deadlines and client expectations don’t always match. It is up to team members to use available historical data and make decisions whether proposed deadlines are achievable. Members who use historical data to suggest extended delivery dates (to meet goals or save money) do so from a position of strength – they have the numbers to back up their projections.
3. Compare project data to industry trends.
Teams can compare forecasts to industry-wide trends to see if their numbers are tracking similarly. A software lifecycle management tool can help by compiling trend data, or teams can gather it themselves. Either way, they should graph trend data against their own data points to see how their staffing and resource levels compare with other, similar projects.
Consider the following example: PI represents a project’s “Productivity Index,” a measurement taken from QSM founder Larry Putnam's Putnam Model, which has been the standard in software estimation for nearly 40 years. The red dots represent a company’s current resource level, while the blue lines indicate industry averages.

Note that the productivity assumption is much higher than normal, resulting in a shorter than usual schedule and effort – a recipe for disaster at delivery time.
A visual representation makes it easier to see where adjustments need to be made to bring a project more in line with the rest of the industry. Tech teams can tell if they are falling behind the curve, ahead of it, or right where they need to be.
4. Determine a project’s impact on an organization's overall budget.
No matter which project they work on, teams should be able to see the potential impact an organization's projects have on one another as well as on the overall development budget and resources. A dashboard can provide an at-a-glance view of all projects and the data relevant to each, such as scheduling, cost, and resources. Team leaders and C-suite executives will appreciate this overall view, as it will help them track when specific projects may be deviating from estimates and threatening to throw an entire IT budget out of whack.
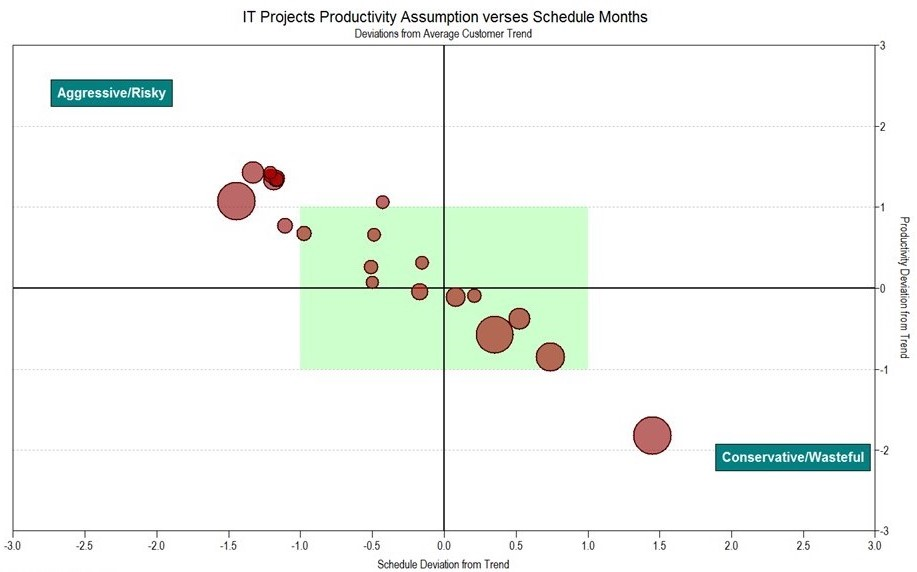
Here’s another example of an at-a-glance view. The red dots represent given projects. The goal is to get them within the green rectangle – the "sweet spot."

Having this information at the ready will help teams identify projects that may be in danger of becoming risky or wasteful. Once again, predictive data helps teams course correct and get back in the green zone.
5. Use available resources fully.
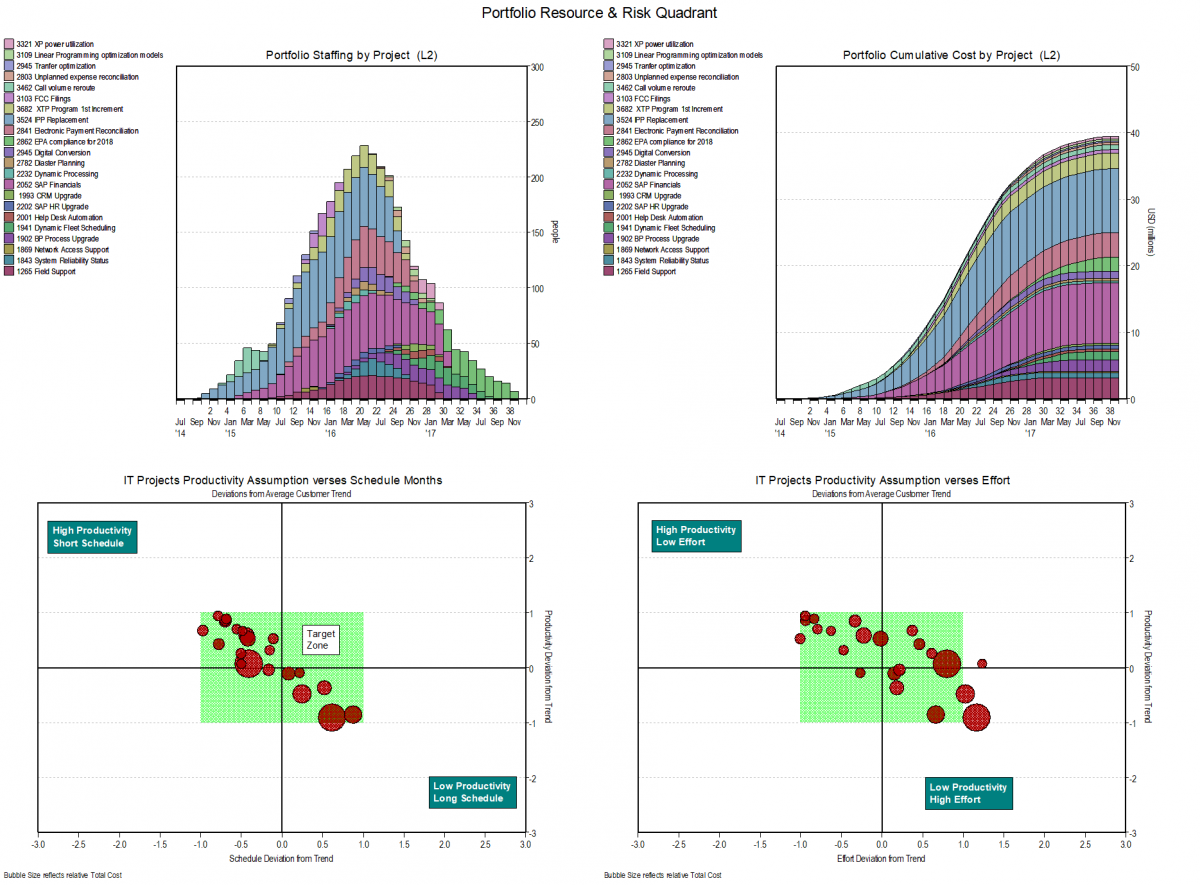
Perfecting the way staff are allocated increases efficiency and minimizes the risk of project failure. In this final example, staffing and cost charts are used to accurately plot staffing resources across the entire project portfolio. With a view of all of an organization’s projects, executives can adjust parameters on risky projects and eliminate overstaffing (which reduces cost and improves quality) from others. Doing so can then quantify the benefits of the optimization process and match demand with current capacity, which ultimately leads to a realistic portfolio plan.

With an entire portfolio of staffing needs captured at a glance, executives can more accurately determine how to allocate sufficient resources to individual projects. Will current resources be enough? Will they need to move team members around to complete a given project on time and within budget? Are new personnel needed? If so, how many should be hired to get to "peak staff?"
Again, methodology clearly doesn't matter here. Knowing which resources are available and optimizing them makes answering those and other staffing questions that much easier. Teams can then complete projects that deliver on clients’ expectations in a realistic timeframe and cost-effective manner – and thus be one step closer to that "magic formula of success."
