“You can’t know where you’re going until you know where you’ve been.”
At this point, we’re about one month into 2013 and many of us have abandoned our New Year’s resolutions. Personally, I prefer to set my yearly goals about a month in because it gives me some time to reflect on what I really want to improve without being distracted by everyone’s bandwagon resolutions like getting in shape or eating less junk food.
The other reason I prefer to wait a month before resolving to do anything is because it gives me time to collect some baseline data. In his Wall Street Journal article, Bill Gates writes, that “you can achieve incredible progress if you set a clear goal and find a measure that will drive progress toward that goal.”
To use the common example of getting in shape, I’m going to explain:
- How to set a goal, and
- How to measure it so that you can effectively achieve your goal.
First you need to set a baseline measure of what your abilities are. How fast and far can you run? How much weight can you lift? How much do you weigh? Knowing the answers to these questions can help you determine what needs improvement.
Next you need to identify your end goal and find a way to quantify progress towards that goal. What does “get in shape” actually mean? Do I want to be able to run faster? Farther? Do I want to be able to lift more weight? Do I want to weigh less? All of these goals can be quantified (e.g. I want to be able to run a mile 30 seconds faster than I currently do, I want to run a 10 miler, I want to be able to bench press 100 pounds, I want to lose 20 pounds).
Once you know your baseline you can figure out some activities you can do to achieve your goal and set a realistic deadline for achieving it. So if you currently can bench press 90 pounds and you want to increase that to 100, you could increase your weight by 1 pound each week. In 10 weeks, you should be able to bench press 100 pounds.
Seeking regular feedback is also crucial to achieving your goals. For instance, if you add weight to the bench press machine before your body can accommodate it you may not be able to lift the weight, or you might hurt yourself by straining your muscles. If you set regular times to measure your improvement you can use this feedback to help you fine tune your deadlines or readjust your end goals to make them more realistic.
Goal setting for project management should be approached in a similar manner. Let’s say you want to improve your organization’s productivity (PI). A good place to start would be in SLIM-DataManager, which allows you to collect data on hundreds of default metrics (see Figure 1). It also allows you to create a custom metric if the one you wish to collect is not already defined. Clicking on the tabs reveals more data fields for metrics you can collect to give yourself a more complete baseline. This is the baseline from which you will build your future goals.

Figure 1: SLIM-DataManager Project Screen
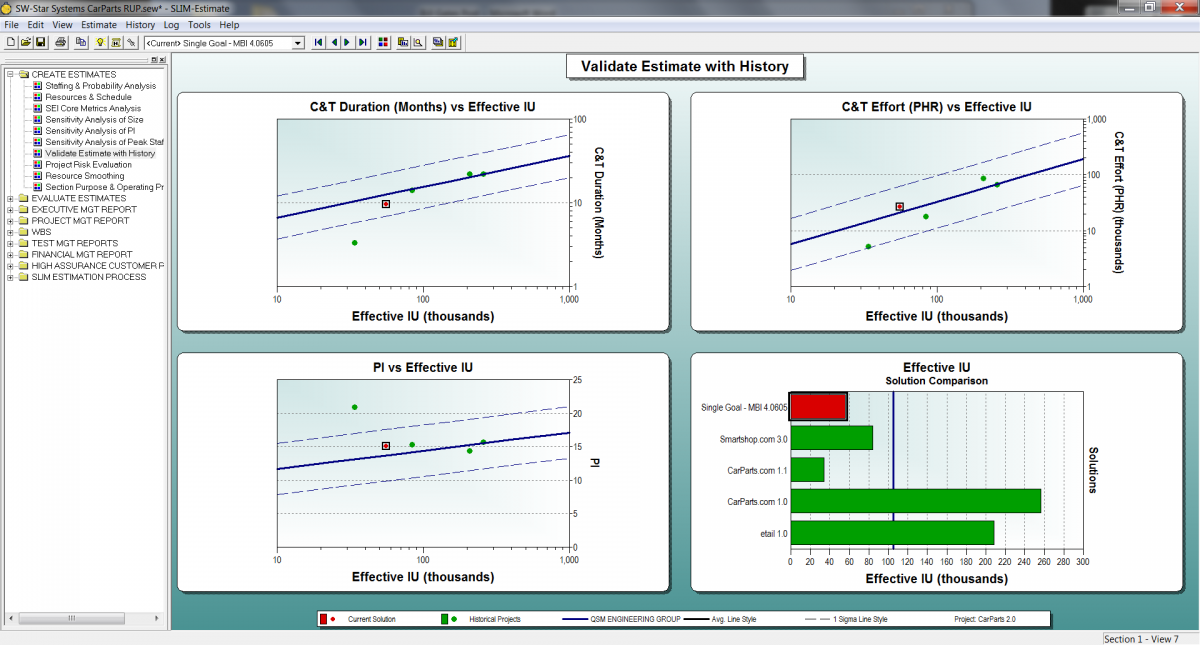
Once you have collected data on your desired metrics, you can create trend lines for your organization which you can use to compare your with your new projects (see Figure 2).

Figure 2: Estimate Compared with Custom Trend Lines
If you’re new to data collection or project tracking and do not have much historical data from past projects you can compare your projects to the QSM default trend lines (see Figure 3). These pre-installed trend lines show industry averages and can be a great place to start if historical data for your own projects is not available.

Figure 3: Estimate Compared with QSM Default Trend Lines
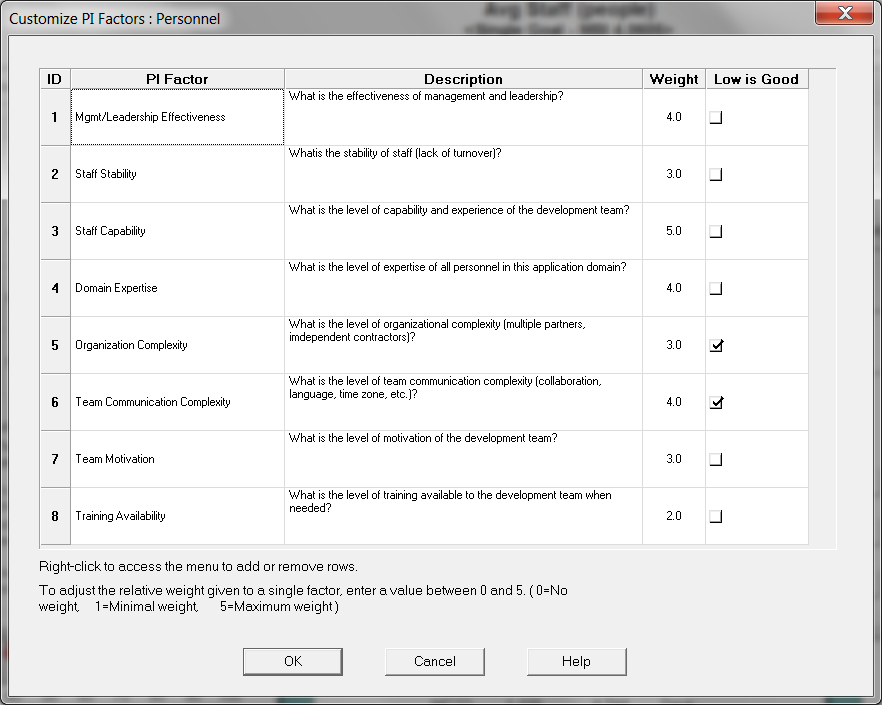
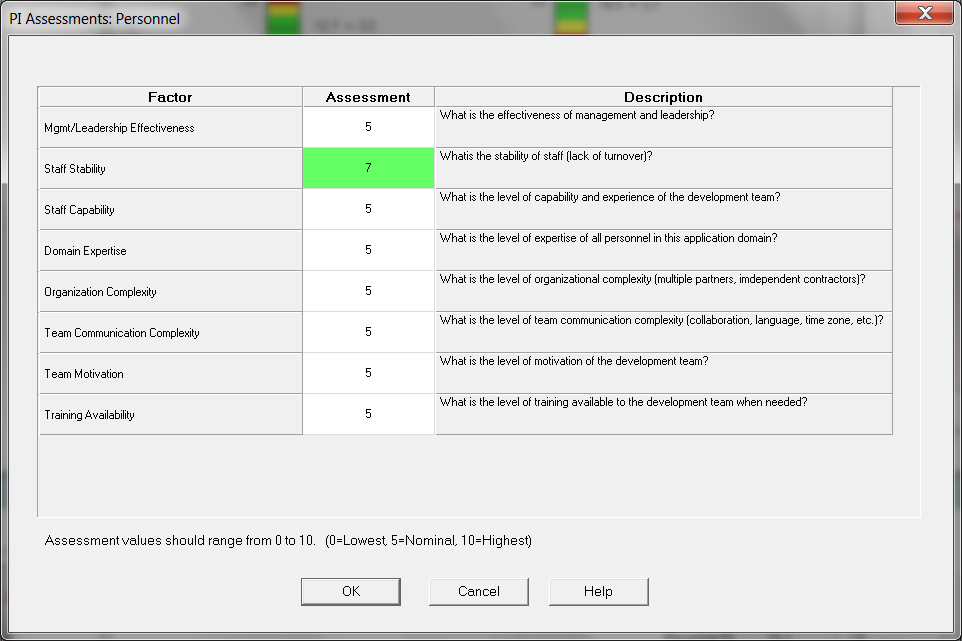
Once you’ve identified how your organization compares with the industry and how your current project compares with historical data you can begin to make organizational process improvements. SLIM-Estimate allows you to customize your PI factors so that you can more accurately reflect which factors influence your PI. Adjusting the PI factors allows you to give more weight to a factor that has a greater influence than the others. Each of the factor categories that impacts PI (Tools & Methods, Technical Complexity, Personnel, and Reuse) has a set of associated questions that you can use to adjust your historical average PIs to account for differences between the current project and your history (see Figure 4). To do this, simply select Customize PI Factors from the Tools dropdown menu and click on the respective PI Factor category buttons to reveal the question lists. You can then rate each factor on a scale of 1 – 10 in the PI Calculator screen (see Figure 5).

Figure 4: Customize PI Factors Screen
Examining these questions will reveal a lot about how your organization operates and which areas need improvements. For instance, if your staff stability is low because of lack of advancement opportunities, perhaps some hierarchical changes to your organizational structure will encourage employees to stay at your company longer, thus increasing the Staff Stability factor rating and improving your PI. Scheduling regular times to measure your PI, such as at the end of each project using the Benchmark Service, will allow you to receive valuable feedback to assess whether or not you are on track to accomplish your goal. As your productivity improves over time, you can go into the PI Calculator window and adjust your question ratings to reflect your improvement (see Figure 5).

Figure 5: PI Calculator Detail PI Assessments View
Whether you’re trying to improve your project productivity or get in shape for your beach vacation, Bill Gates’ process of “setting clear goals, choosing an approach, measuring results, and using those measurements to refine [your] approach – helps us to deliver tools… to everybody who will benefit.” Familiarizing yourself with your historical data or “where you’ve been,” will help you figure out “where you’re going” and help you achieve your goals.
