Several months ago, I presented SLIM-Estimate’s use of uncertainty ranges for size and productivity to quantify project risk. Estimating these two parameters using low, most likely, and high values predicts the most probable effort and time required to complete the project. This post shows you how to use SLIM-Estimate’s probability curves to select the estimate solution and associated work plan that includes contingency amounts appropriate to your risk.
Begin with an unconstrained solution
The default solution method used for new estimates, whether you are using the Detailed Method or another solution option, is what we call an unconstrained solution. Just as it sounds, no limits have been placed on the effort, schedule, or staffing SLIM-Estimate can predict. It will calculate the resources required to build your product (size) with the capabilities of your team (PI). Assuming you have configured SLIM-Estimate to model your life cycle and based your inputs on historical data, you have produced a reasonable, defensible estimate.

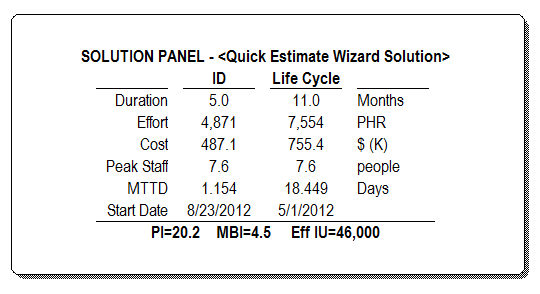
Let’s say you been asked to estimate and manage an Agile project with a size of 46,000 Implementation Units (IU), +/- 20% uncertainty. You use a PI of 20.2 +/- 15% uncertainty from the QSM database, because your organization has not completed enough Agile projects to have your own PI value. An unconstrained solution with these inputs results in the project plan shown in the Solution Panel. This project is expected to cost is $755,400 and take 11 months, with a peak staff of 7.6 people.
SLIM-Estimate presents the solution with the highest probability ‒ the 50% solution. If you ran this project 100 times, 50 would take longer and use less effort, and 50 would take more effort and use less time. This seems a little risky. If you would like to be more confident in your proposal to your manager or customer, you have to select a work plan with a higher probable outcome.
Specify the contingency
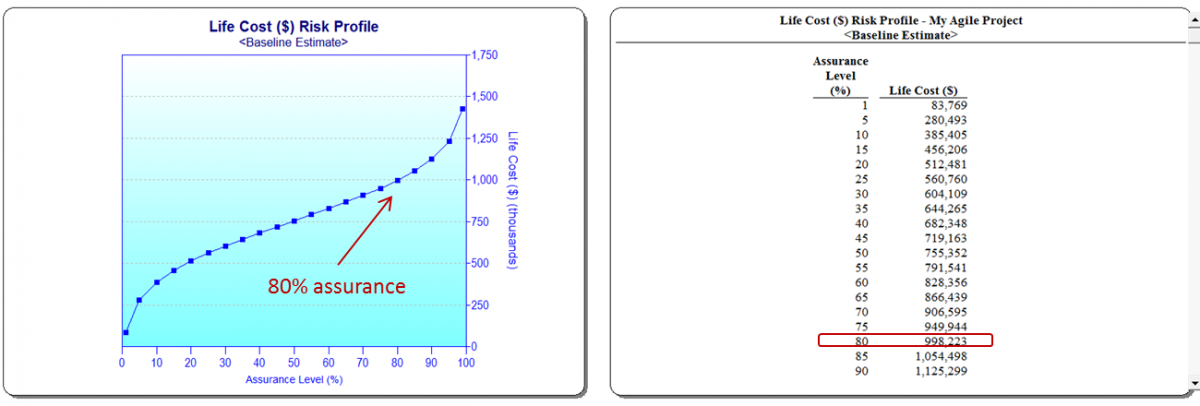
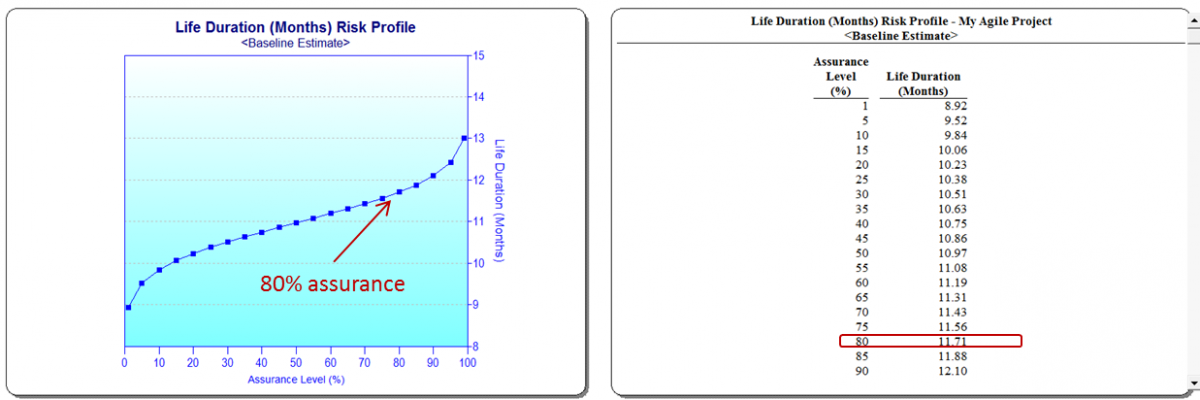
The Cost Probability Profile and Schedule Probability Profile views display curves resulting from SLIM-Estimate’s Monte Carlo Simulation, calculated using the range of uncertainty specified for size and PI. To be 80% confident that your team will deliver on time and within budget, you need 11.7 months and $998,223. You have calculated a specific contingency for both time and effort: 0.7 months (roughly 3 weeks), and $242,871 respectively.


Your work plan is still the 50% solution; you plan to finish in 11 Months and hold your cost to $755,352.
Communicate the detailed work plan
Now that you have committed to the project, your next steps are to create the detailed plan and set up project tracking and control procedures. SLIM-Estimate provides a large variety of detailed reports and charts for communicating specific development activity tasks to be performed, and the associated schedule, effort and cost expectations. Reports can be exported to either MS Project or MS Excel, where you can add more detail to the WBS and resource allocations.
Remember that you have committed to deliver a quality product in 11.7 Months, at a cost of $998,223. The schedule and budget reserve must be managed as the project progresses. The time buffer is small, so you will need to watch that closely. The budget reserve will allow you to increase effort, but you will have to balance that with the potential for added defects and rework. In the next blog post I will show you what the SLIM-Estimate work plan looks like in SLIM-Control, and how to specify metrics and control bounds to manage the contingency reserve.
