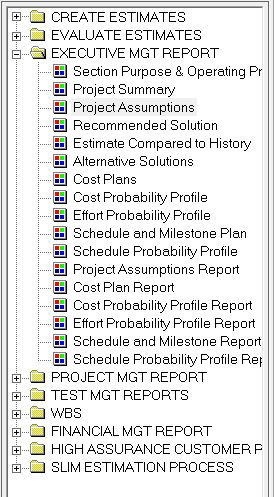
SLIM Suite default workbooks contain pre-defined views you can customize to fit your reporting needs. The Navigation Panel on the left side of the user interface displays the list of views, organized into sections or folders. Each SLIM tool contains multiple views to facilitate presentation and analysis of the unique metrics it employs.

Figure 1: Navigation Panel
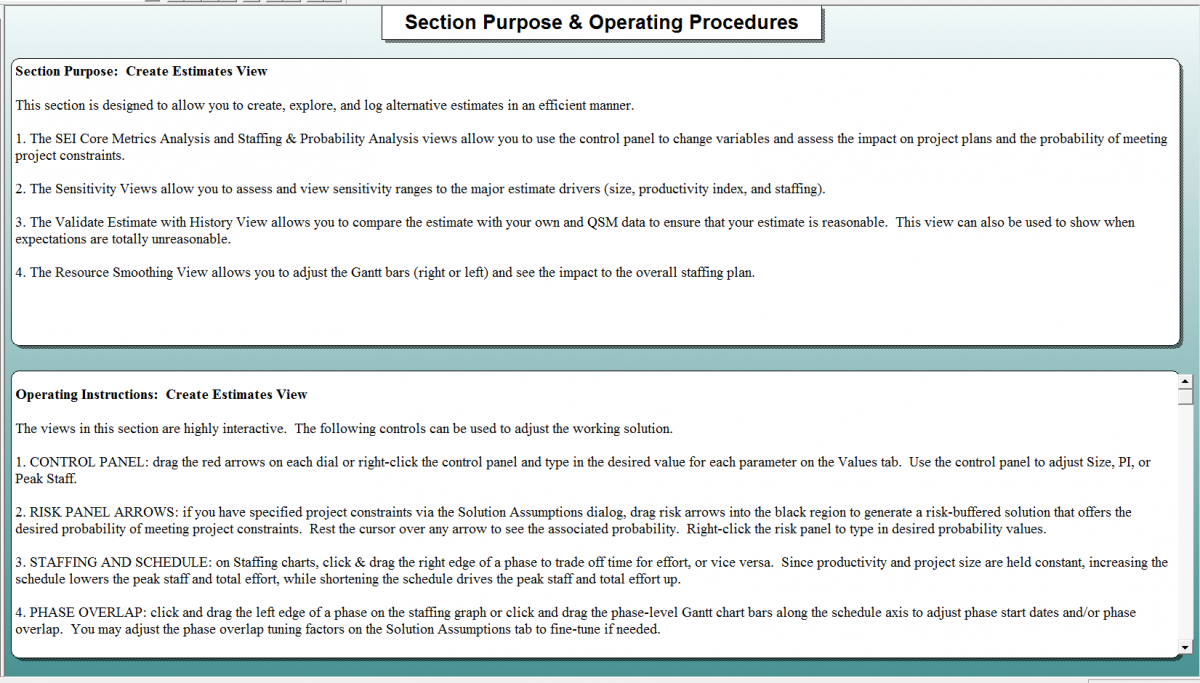
One of the most valuable and flexible objects to include in a view is the Note Panel. Just as it sounds, it is simply a note pad where you can include descriptive text about estimation assumptions, findings, questions, instructions to SLIM users.... the possibilities are numerous. QSM uses the Note Panel to provide instructions, tips, and easily customizable project and executive summary reports. The view below shows the Section Purpose & Operating Procedures view, which describes other views in the folder, along with suggestions for tailoring subsequent charts and reports.

Figure 2: Note Panel View
You can use notes to document the estimation procedure you want others in your organization to follow. Use notes to document the special background information that explains why the recommended solution meets the most important project goals and constraints.
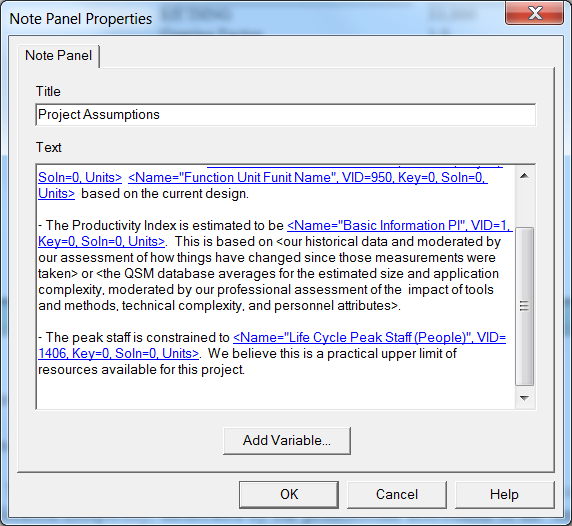
A powerful Note Panel feature you may not be aware of is the ability to add variables. Any metric available for inclusion in charts and reports can be inserted anywhere inside the text box. Simply place the cursor where you want the metric to appear, and select the Add Variable button. You can see that this Project Assumptions report includes the Function Unit, PI, and Peak Staff variables (blue underlined text).

Figure 3: Note Panel Properties
In SLIM-Estimate, you can specify whether each note will reference the Current or Selected Solution. The report is automatically updated to display the solution you want to present. SLIM-Control provides several predefined Earned Value reports using the note panel.
I have seen some creative views that combine note panels and a variety of charts, where the note panel is used to summarize or highlight the main points of the display. Take time to look at the sample views provided with your SLIM product. Play around with the number of charts or reports and various combinations to see which style best suites your organization. Once you settle on the standard views you wish to present to executives and clients, remove the extra sections for a cleaner display.
I had a college professor who said, “I don’t care how smart you are if you can’t communicate it to anyone.” I pass on these words of wisdom simply to acknowledge that presenting technical data is challenging, however, creative use of SLIM’s Note Panel and other view options will help you communicate the results of your good life cycle management practices.
