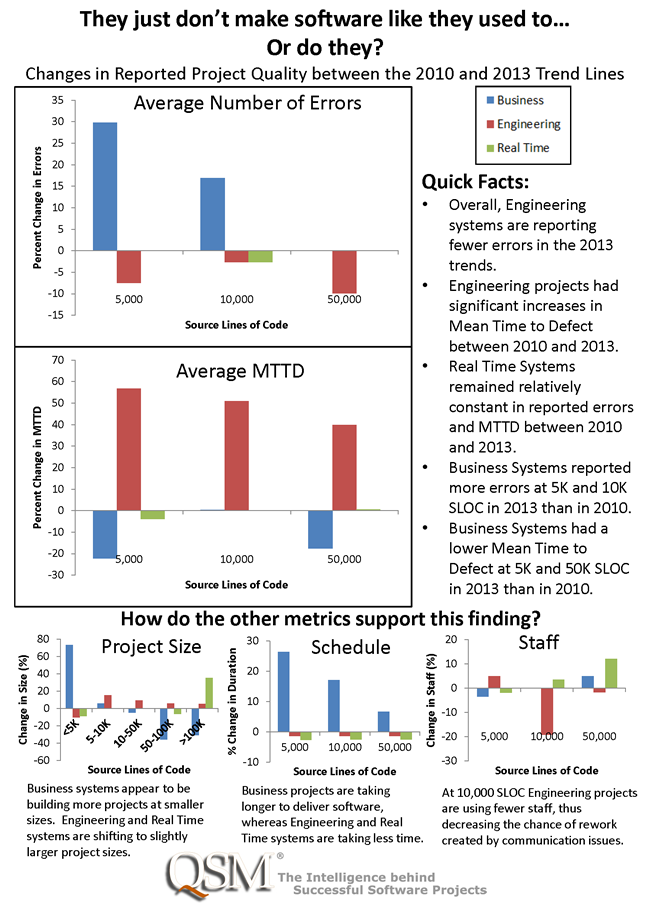
With the release of SLIM-Suite 8.1 quickly approaching, I thought I’d take a moment to share a preview of the updated QSM Default Trend Lines and how it affects your estimates. In this post I wanted to focus on the differences in quality and reliability between 2010 and 2013 for the projects in our database. Since our last database update, we’ve included over 200 new projects in our trend groups.
Here are the breakouts of the percent increases in the number of projects by Application Type:
- Business Systems: 14%
- Engineering Systems: 63%
- Real Time Systems: 144%
Below you will find an infographic outlining some of the differences in quality between 2010 and 2013.

From the set of charts above, we can see some trends emerging which could indicate the changes in quality between 2010 and 2013. By looking at the data, it’s apparent that two distinct stories are being told:
1. The Quality of Engineering Systems has Increased
Overall, the Engineering Systems showed a decrease in reported errors and an overwhelming increase in Mean Time to Defect (MTTD). Although they had a slight increase in project size, with a greater number of projects that were larger than 5,000 SLOC, Engineering projects also decreased their team sizes and schedule durations. Using smaller teams can drastically decrease potential miscommunications among developers, thus reducing the overall number of errors generated. With fewer errors present in the system, the amount of rework is minimized which, in turn, reduces the overall schedule duration. Additionally, fewer errors present at the ship date also lead to a higher MTTD and quality rating.
2. The Quality of Business Systems has Decreased
On the other hand, Business Systems showed an increase in errors generated and a decrease in MTTD. With more Business Systems shifting their project scopes to smaller sizes (<5,000 SLOC), likely due to the popularity of Agile methods, it’s natural to see the decrease in staff size at 5,000 SLOC, because there is less work to be done. However, Business Systems also reported more errors and lower MTTDs than in 2010, yet they’re taking longer to deliver. It’s possible that one of the reasons we’re seeing this is that projects are decreasing their functionality (perhaps to help meet a schedule deadline), and do not have enough time to properly test the software for defects. Consequently, their first ship date might therefore occur at the height of defect arrival rates, before developers have had time to correct the bugs. This ultimately results in extending the project schedule to allow for defect removal later on in the project lifecycle.
So what does this mean for your projects?
While it’s good to examine the error counts or MTTD’s individually, you also need to look at how that affects your project holistically. In this dataset it appeared that having an increase in errors was related to a decrease in quality. While that may be true, that is not necessarily the only outcome of a high number of errors present. If you found that you had a high number of reported errors but also a high MTTD, it could indicate that developers are finding more errors in testing and fixing them before shipment, thus indicating a good quality project. Therefore, it is important to examine how all these metrics could affect each other. With development methodologies shifting to smaller scopes with shorter schedules and smaller staff sizes, it’s more important than ever to collect defect data on your projects. Meeting the goal of a shorter schedule deadline may be good, but if it it’s at the expense of the projects quality, is that really a desired outcome? In short, collecting defect data and analyzing its effects can help indicate whether or not your organization is moving in its desired direction.
