It’s that time of year again for many C-level executives: time to figure out the IT budget for next year. This is to bring the business side of the organization to the table with the technical side to forecast how much IT is going to spend. It can be a complicated process, but there are ways to make it easier and more accurate; and there are ways to save a lot of time and money. The challenges often relate to short planning time frames, minimal information available to generate accurate forecasts, political agendas within the organization, and, unfortunately, only a small number of estimation methods in place. But there are tools and processes available to help face these challenges. Here are the basic steps that we recommend for cost optimization in the budgeting process.
Start by analyzing the historical data that is available. The process can be streamlined by focusing on the core metrics within the organization. This data can include release level size, effort, staff, and duration information. Historical data showing typical effort by role by month spending is also valuable to leverage. Ideally, this type of data should be captured on 8-15 projects.
The next step is to pull together scope level sizing data on projects that are being considered for the new year. This information can include epics, themes, user stories, business requirements, or use cases, to name a few. The goal here is to get as close as possible to determining how much work needs to be done on each release in the pipeline. Once there is a large enough sample of data, then release level estimates can be created for the coming year. There are tools available to help streamline this process and the best ones allow for risk mitigation and sanity checking with historical data.
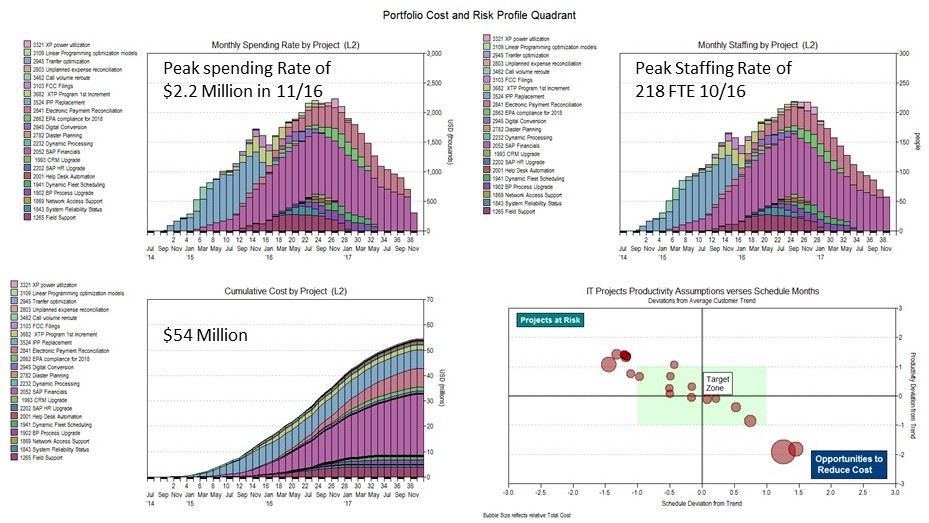
After the release level estimates are generated, a “Masterplan” can be generated incorporating all of the project estimates together in a big picture view, taking into account the dependencies from project to project. This could be used to make sure that the organization is not over utilizing our staffing resources across the project portfolio. Once this “Masterplan” is submitted, then budget plans can be analyzed at the enterprise level. The view below shows the “as submitted” portfolio with a peak monthly spending rate of 2.2 million dollars, a peak staffing of 218 full time employees, and a cumulative cost of 54 million dollars. The bubble chart on the bottom right of the view shows that there are some projects that are extremely risky. This is an early red flag showing that the organization will not hit its goals as they were initially proposed.

As Submitted Portfolio
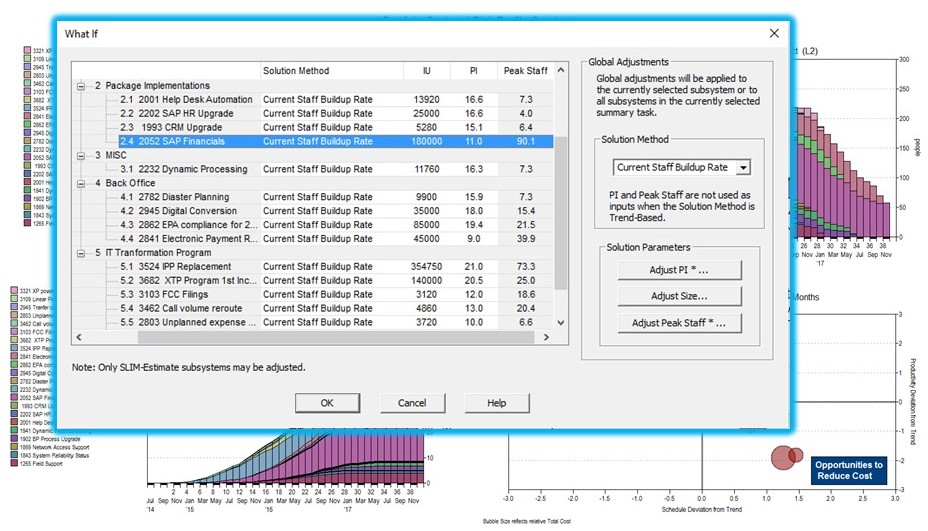
The next step would be to make some adjustments for the project releases that are not falling within the “target zone” shown on the previous bubble chart. These decisions can be negotiated between the business and technical managers in the organization and these forecasting tools can bring everyone to the negotiating table with empirically based information so the budgets can be set reliably. The view below shows some adjustment options. Tradeoffs can be evaluated for staffing, productivity, and functionality.

Adjustment Process for Projects Not in the Target Zone
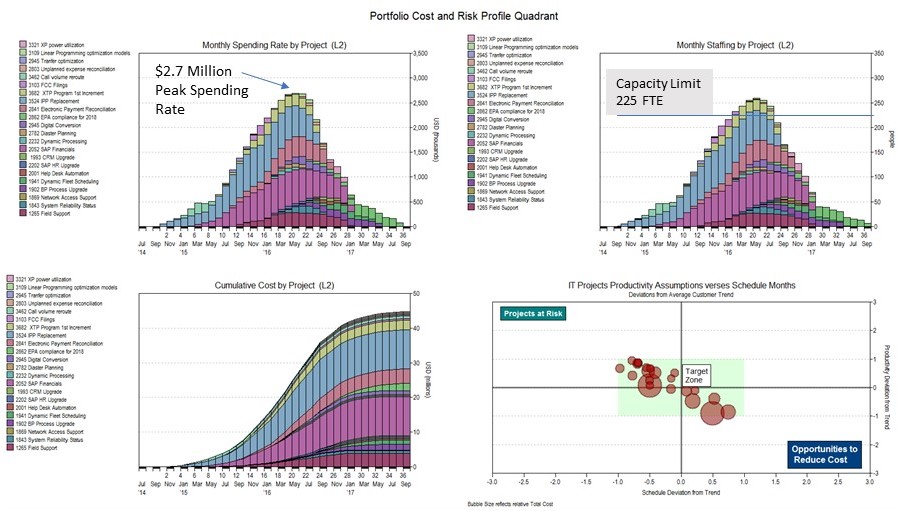
The next view shows that the adjustments made to bring each release into the target zone caused the overall portfolio spending and resources to move past the organization's capacity at the enterprise level.

Portfolio Adjusted for Risk and Waste Drives Spending and Resources Above Capacity
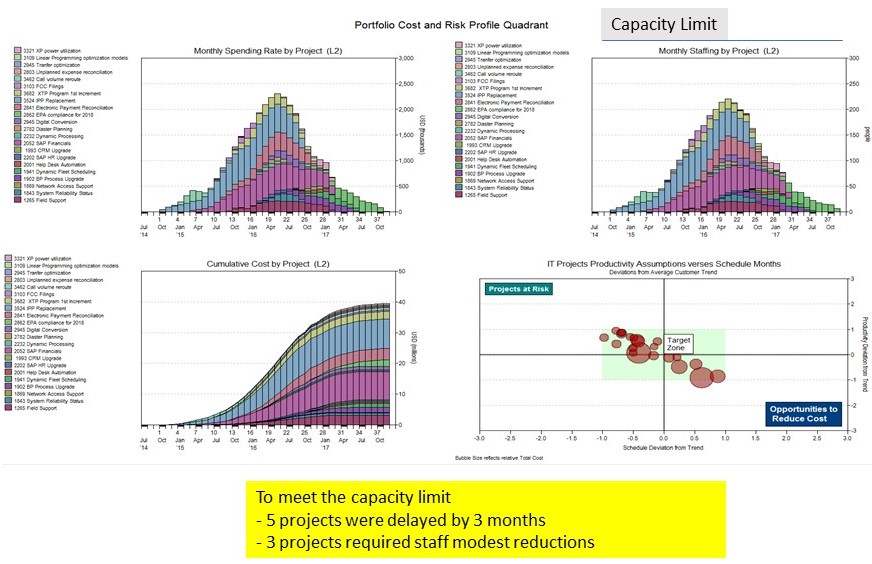
At this point, C-level executives need to make some decisions to align release level goals with enterprise capacity limits. Typical adjustments made here could include slipping the start date on some of the projects, and/or re-evaluating the staffing levels on some of the projects. Outsourcing options can also be considered. The view below shows that delaying 5 projects by 3 months and reducing the staff modestly on 3 projects allows the group to achieve their enterprise budget goals.

Further Adjustments to Meet Capacity Limits
By leveraging empirically based forecasting models with a budgeting process that brings together release and enterprise level data, transparency can be increased across the organization and at the same time save weeks of planning effort and millions of dollars in IT spending.
