How many times have you been in a situation when plans for cost, quality, staff, or duration have been confirmed, but a few weeks later the program veers off track? Maybe the targets were unrealistic, the requirements changed, or there were communication disconnects along the way. Unfortunately, these issues happen all the time with digital transformation, often times after the delivery roadmap has already been set!
Digital transformation is a big topic these days and the benefits can be huge. Many organizations are re-examining the way they do business from rebuilding in-house systems, to moving to the cloud, to changing how they interact with their clients. They are trying to answer questions like: how can we improve our decision making processes? And how can we better support our clients? Building the technology to support changes can be a complicated road. Wouldn’t it be great to be able to leverage a navigation system for these challenges? A system that provides a big picture view and also the necessary details to help guide your team as they move forward. At QSM, we provide this type of solution for our clients. It’s called SLIM-Control, a data-driven adaptive forecasting tool that curve fits to the actual data that directly reflects what’s happening throughout the transformation process. The cost, schedule, and quality forecasts are generated by the actual data and QSM's empirically-based models.
SLIM-Control supports digital transformation much like a GPS provides support as you travel in your car. It lets you see where each program is at the present time, tracks your progress, and then shows you where you should be in the future, even if things change along the way. Multiple programs can also be viewed, estimated, and tracked together at the organizational level using SLIM-MasterPlan. This is especially important when dealing with hundreds of moving parts that affect big organizational changes.

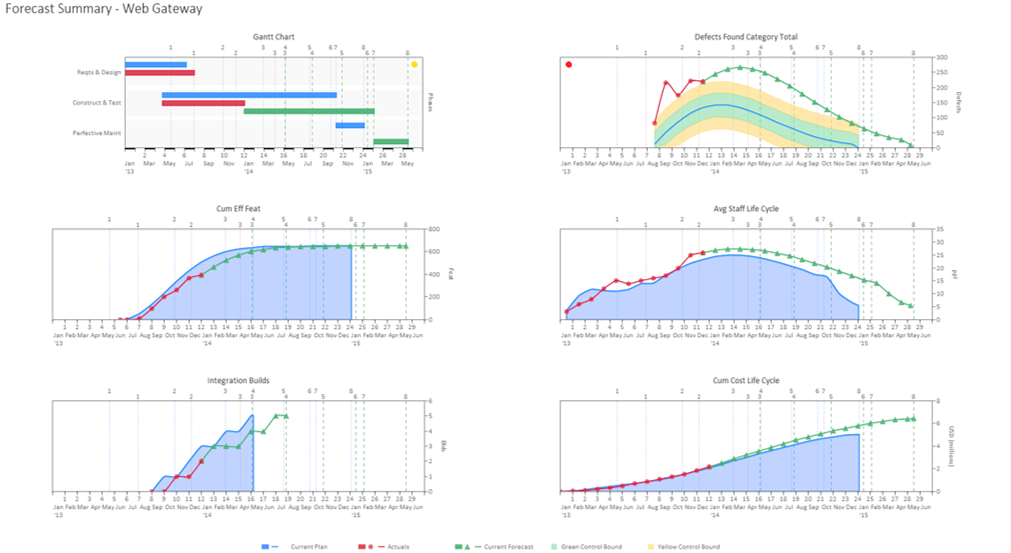
Successful navigation for each program can start by tracking three data points once a month: number of people, scope delivered, and defects found. Macro-level inputs are the key here. Only the totals are needed. Once the data is entered, you will be able to see how your team is performing by looking at the initial plans in blue, the actuals in red, and the forecasts in green. You can see in the example above that this delivery is in trouble. The new features are behind schedule, defects are higher than expected, and the data is confirming that this team will be late and over budget if they continue down the same path. A rocky road to say the least!

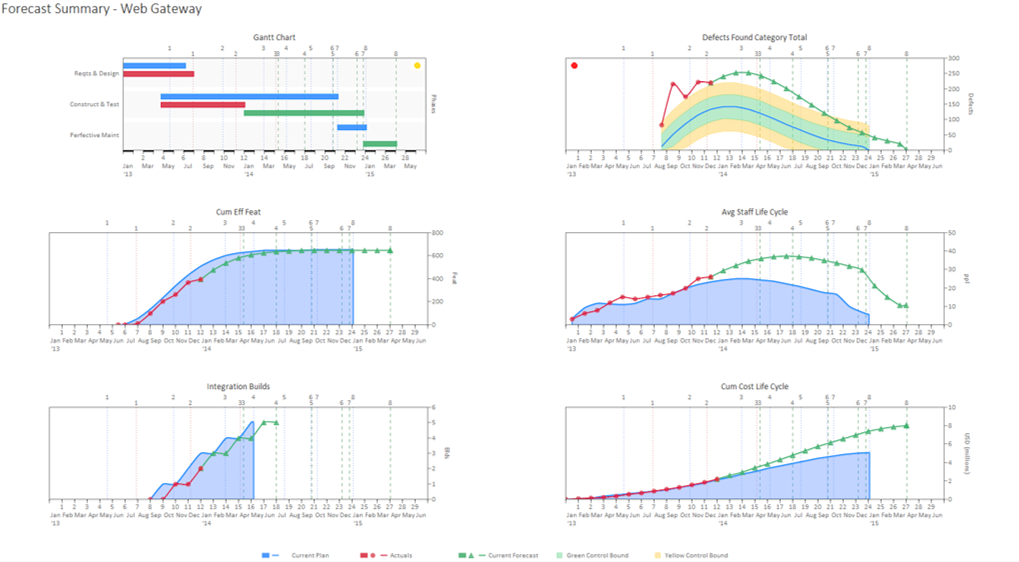
Once you have seen the forecasts, you can then begin to look at multiple risk trade-off options to bring the team back on track. In the view above, you can see that increasing the staff to finish sooner would not work out very well. The additional staff would drive the cost way up with only a modest amount of schedule compression and the defects would remain high past the delivery target date. This is valuable information to know as you negotiate with your stakeholders.

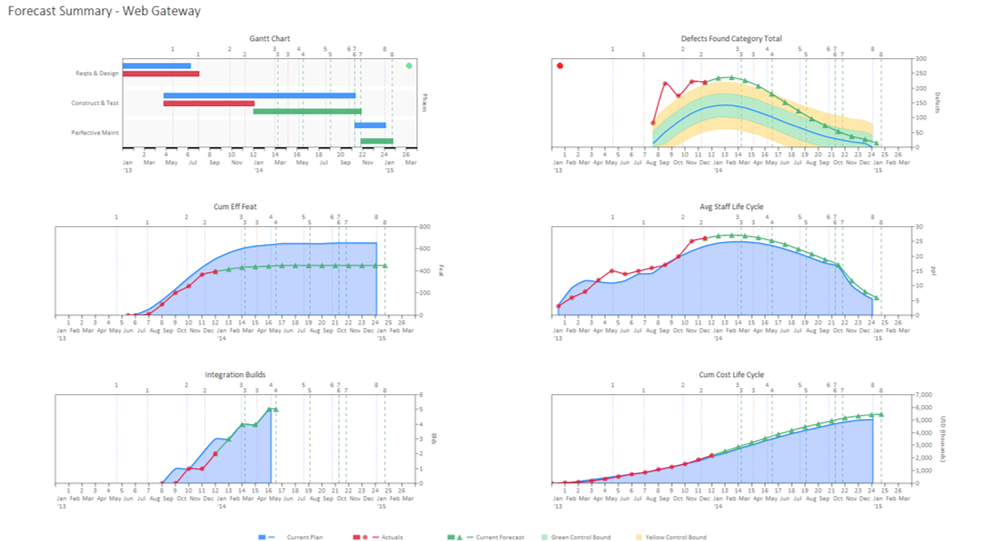
Another option might be to reduce the scope. Maybe the client can live without some of the features until the next release. Above, you can see that reducing the scope in this situation helps and might be a viable alternative. The cost, defects, staffing, and schedule are now more in line.
These are just a few examples of how you can leverage analytics and empirically-based forecasting tools to make better in-flight navigation decisions, and actually make sure that your digital transformation is on the right path. These types of solutions also improve the ability to negotiate with stakeholders. They provide comparisons with industry trends to ensure that your updated path has reliable cost, quality and schedule targets.
Want to learn more? Contact us and we’ll show you how easy it is to get started!
