Stripped down to the bare bones, value in software estimation measures the functionality that a software product provides to its users (both human and non-human) while production cost measures not just value but the work that is required to deliver that functionality. Software estimates need to account for both. Examples of non-functional cost items include configuration, throw-away code, cloud architecture, and quality requirements. Size measures such as IFPUG and NESMA function points quantify value (delivered functionality) and are recognized as functional size measures. Both measures intentionally ignore technical requirements. They can be very useful when used for asset management, measuring scope creep on a project, or assessing software quality (defect density per delivered unit). For estimating they are an important input; but one that needs to be supplemented to reflect the non-functional cost factors: i.e. what needs to be done behind the scene to create that functionality.
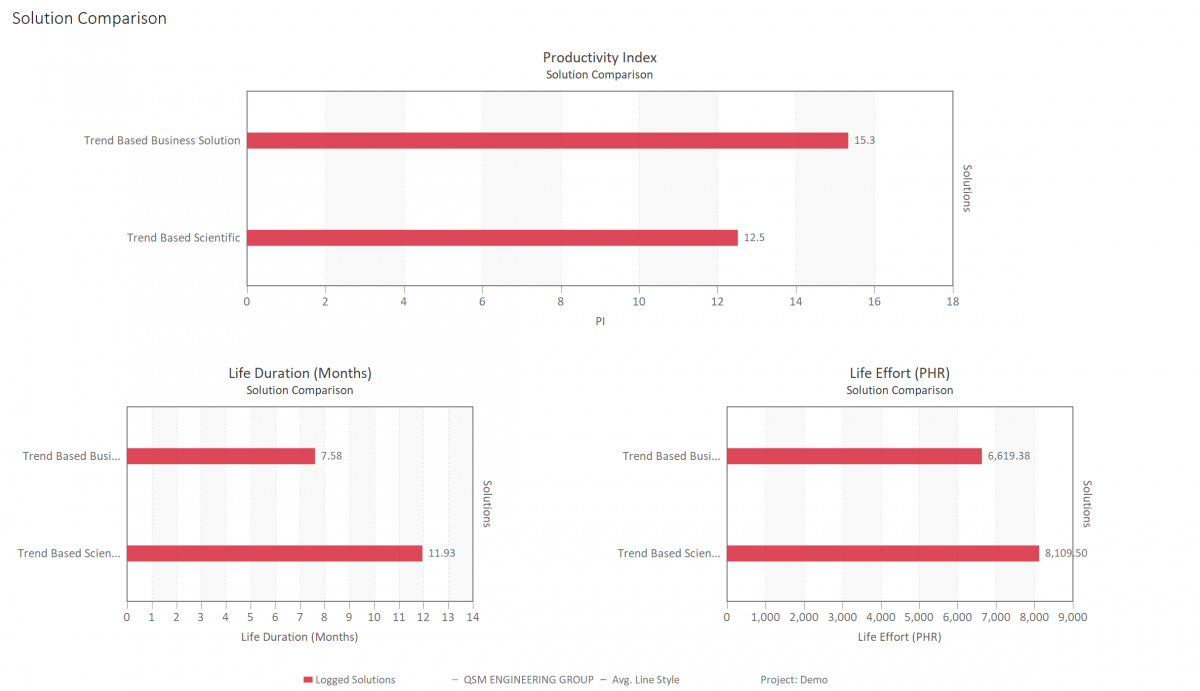
Two ways to accomplish this come to mind. The first is to adjust the expected productivity in the estimate to reflect the complexity of the product being developed. Here’s a simple example. A company has two divisions. One creates and markets software for inventory control. The other develops software for medical devices such as heart monitors. Both teams have skilled sets of developers. Let’s say the projects that develop these products have a similar functional size. Which will take longer and cost more to develop? The answer is pretty obvious: the project that develops the medical devices which require extensive and detailed design activities and have exceptionally high quality and performance requirements. So, when estimating development cost and schedule we would lower the productivity (expected throughput) for projects developing medical devices compared to the inventory control projects. As a side note here, having some historical projects for both project types to compare against provides an empirical basis for determining an appropriate productivity level that reflects our proven ability to build and deliver similar functionality. Below is an example that illustrates this. The inventory system is a Business IT project while the heart monitor belongs to the Scientific domain. The SLIM-Estimate tool used here calibrates these application types differently based on historical performance which is illustrated in the graphic for the productivity index. A large part of the difference between the two projects in effort, schedule, and productivity is due to the different quality requirements of the two products. An error in an inventory system may be costly and inconvenient. An error in the heart monitor software is potentially lethal.

The second way is to size the non-functional portion of a project and combine that with the functional size to obtain a total project size. There is no official way to do this. IFPUG has developed SNAP points as a way to size non-functional requirements such as quality. Perhaps, a way to combine these with function points for estimating will be developed, hopefully, in the not too distant future. For ERP implementations, QSM estimates the configuration steps that must be performed in order to size the non-functional portion of these projects. The sum of these is added to the functional size derived from RICE objects (Reports, Interfaces, Conversions, Enhancements) to determine a project size.
More work remains to be done in developing methods to determine project size for estimating development cost and schedule. The functional size of a project (i.e., features delivered to end users) is an important component of development work; but not the complete picture.
