Donald Beckett's blog

Donald Beckett's blog

Practical Software Estimation Tips for Communicating with Business Leaders

How large is your project?
It’s projected to cost $2,000,000.
That’s cost. not size!

How large is your project?
We believe it will take 14 months to complete.
That’s schedule, not size!

How large is your project?
It’s going to be a 25-person project.
That’s staff, not size!

Software estimators often think of project size as what a project produces (features, stories, requirements, function points, or code). These are what a project has to create or account for in order to fulfill its mission. Business leaders, understandably, are more likely to visualize project size in terms of resources expended (cost, time to market, or FTE staff).  These competing definitions of “size” can produce confusion and ambiguity. Which leads us to Tip #1.

Tip 1

Be prepared to explain to business leaders how quantifying project size (as seen by an estimator) helps business leaders get more accurate estimates of the things that matter to them: cost, schedule, quality, and staffing. I find a graphic like the one below from SLIM-Estimate can be useful to illustrate the relationship between a project’s size (primarily of interest to development staff and project managers) and the major project management metrics of interest to the C-suite.

Blog Post Categories 
Estimation Cost Effort Sizing Schedule

Circa 2021, What Does a “Typical” Software Project Look Like?

Background

No two software projects are exactly alike. So, one way to find out what a “typical” software project looks like is to take a large sample of completed projects from the QSM historical database of over 13,000 completed software projects and look at measurements of central tendency for staff, effort, size, schedule duration, and productivity.

For this study, QSM looked at validated projects that completed beginning in 2010. We eliminated 1 person projects and those that expended less than 1 person month of effort. The eliminated projects accounted for 13% of the sample. About 80% of the projects fell into the Business IT application domain, many of which were from the financial services sector. This domain includes projects that typically automate common business functions such as payroll, financial transactions, personnel, order entry, inventory management, materials handling, warranty and maintenance products. We determined both a median and an average for each metric. With the exception of schedule (project duration), these differed significantly which indicates that that the sample metric values were not normally distributed. To minimize the effect of unrepresentative projects (those that comprise a small part of the sample, but whose metric values are very large or very small), we decided to use the medians – values with 50% of the projects above and 50% below the “average” as a better measure of central tendency.

The "Typical" Project

Metric

Median

Average Staff (Full Time Equivalent)

4.87

Simplified Function Point Analysis (SiFP)

One of the stated purposes of function point analysis is to provide a size measure that can be used as an input to help estimate the cost, effort, schedule, and staff needed to develop a software project. The standards for how this is done are maintained by the International Function Point Users Group (IFPUG). In a nutshell, function point analysis identifies, from a user perspective, logical groups of data that a project or application maintains or accesses and logical processes that update, query, transmit, or report on that data. The counting rules are extensive, very specific, and assign function point values to these based on the number of data stores a process accesses and the data elements it touches. To help assure that function point counting is conducted in a standardized manner, IFPUG certifies counters who have demonstrated mastery of the counting rules through passing an exam. These counters have the title of Certified Function Point Specialists (CFPS).

There is a problem with using traditional function point analysis in the conceptual phase of a software project when the budget, schedule, and staffing are being planned: the information required to count function points according to the rules is normally unavailable and, in many cases, does not yet exist. To overcome this obstacle, function point counters have devised a number of quick counting methods to estimate project function point counts. Most of these are rules of thumb whose implementation varies from one counter to another.

SiFP was developed by Roberto Meli and associates in Italy. In 2019, IFPUG acquired the rights to the methodology and plans to integrate it into its portfolio in 2021.  Follow this link for more details.

So how does SiFP differ from regular function point analysis, and why is it simpler? Three differentiators stand out:

Blog Post Categories 
Function Points Sizing

Value vs. Cost in Software Sizing and Estimation

Stripped down to the bare bones, value in software estimation measures the functionality that a software product provides to its users (both human and non-human) while production cost measures not just value but the work that is required to deliver that functionality. Software estimates need to account for both. Examples of non-functional cost items include configuration, throw-away code, cloud architecture, and quality requirements. Size measures such as IFPUG and NESMA function points quantify value (delivered functionality) and are recognized as functional size measures. Both measures intentionally ignore technical requirements. They can be very useful when used for asset management, measuring scope creep on a project, or assessing software quality (defect density per delivered unit). For estimating they are an important input; but one that needs to be supplemented to reflect the non-functional cost factors: i.e. what needs to be done behind the scene to create that functionality.

Blog Post Categories 
Sizing Estimation SLIM-Estimate

How Does Agile Quality Compare?

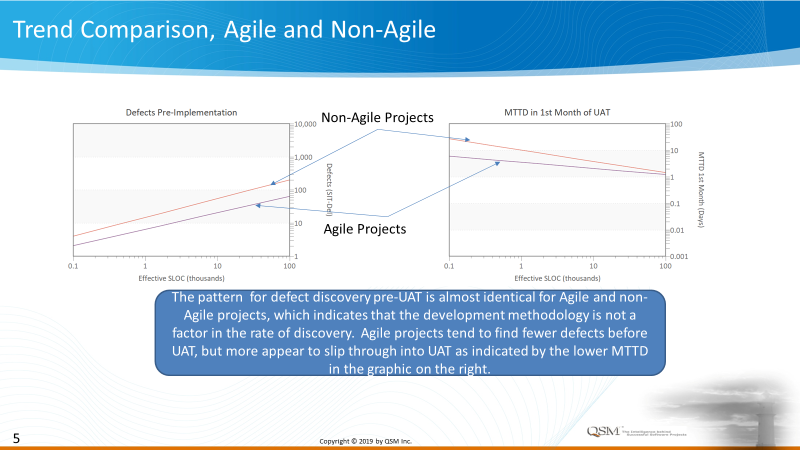
During a recent consulting engagement, a customer asked if the QSM defect discovery model applied to Agile projects.  Of course, the best (and only) way to determine this was empirically.  From our database we extracted a sample of business IT projects that had completed since 2013 that recorded pre-implementation defects.  81 of these projects were Agile and 354 did not specify Agile as their development methodology.  We created average trend lines for both datasets and they displayed very similar patterns that conformed to the QSM defect discovery model.  This allowed us to answer our customer’s question affirmatively.

Agile Quality

Having a large project sample at hand and being curious, we decided to compare these metrics:

  • Mean time to defect (which measures the average time a system runs defect-free in the first month after implementation)
  • Average development time in months
  • Staffing
  • Cost/effort

Agile Quality

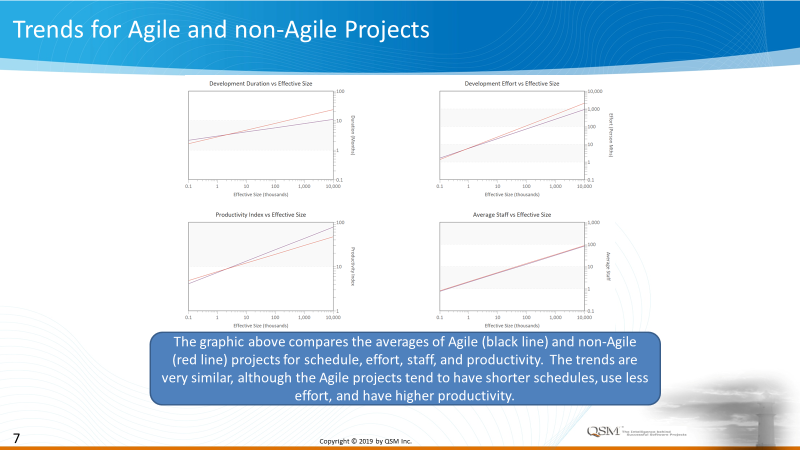
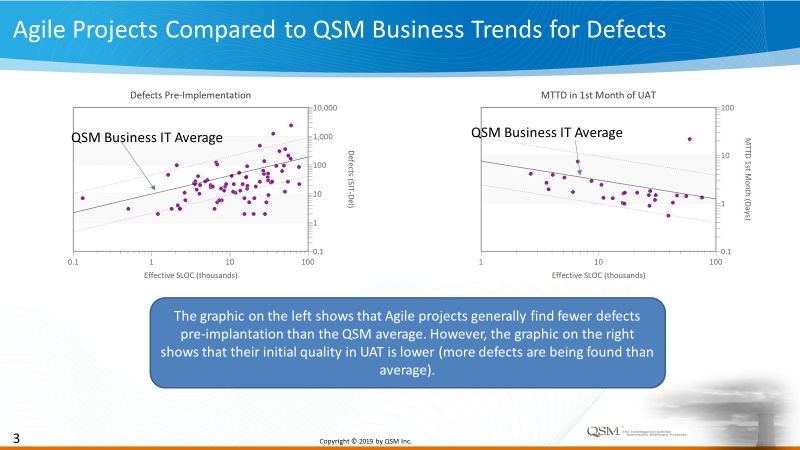
In a nutshell, the Agile and non-Agile projects used very similar staff sizes.  The Agile projects completed sooner and expended slightly less effort.  Quality was where the two project sets differed significantly.  Pre-implementation, Agile projects recorded fewer defects than non-Agile ones.  However, post-implementation the non-Agile projects operated longer between discovering defects in production than did Agile projects.

Agile Quality

Blog Post Categories 
Agile Quality

Monitoring Software Project Progress by Money Spent Can Be Misleading

Sound financial practices are a core value of any successful enterprise; and should be.  It may come as a surprise that monitoring money spent against planned expenditures is not the best way to evaluate the progress of software projects.  The reason is simple:  by the time financial measures indicate that a project is off track, it is often too late to take effective corrective actions or identify alternative courses of action.

Here is an example that illustrates this.  Let’s take a hypothetical project plan with these characteristics:

  • Planned project duration of 1 year
  • Full time staff of 6 for the length of the project
  • Billing rate of $100/hour
  • 335 business requirements to complete
  • Project begins at the start of June and is scheduled to complete May 31 of the following year

According to this plan, the project should have a labor cost $1.245 million.  Now, using a software project monitoring tool, SLIM-Control, let’s see what the project looks like at the end of September. 

Software Project Cost

If we only look at money spent, the project is on track since planned and actual expenditures are exactly the same.  However, when we look at the progress of the actual work completed, a different story emerges.  The project got off to a slow start and the gap between what was planned and what has been delivered has increased every month.  Unless this is rectified, the project will last longer and cost more than originally planned.  Here is a forecast of what will happen if the current trend continues.  The project will complete over two months late and cost an additional $215,000.

Blog Post Categories 
Effort SLIM-Control Tracking

The Balancing Point between Project Cost and Schedule

In all production environments, there exists a tension between competing outcomes.  Four variables come to mind:

  • Cost/Effort
  • Schedule
  • Quality
  • Productivity

These do not exist independently of one another.  Emphasizing any one impacts the others.  For example, to compress a project’s schedule, additional staff is typically added which increases the cost.  Larger team size also increases communication complexity within a project which leads to more defects (lower quality).  The development of software  presents a unique issue that may not be present or is at least more muted in manufacturing:  non-linearity.  Key examples of this are the relationships between cost/effort and schedule and the one between schedule and quality. 

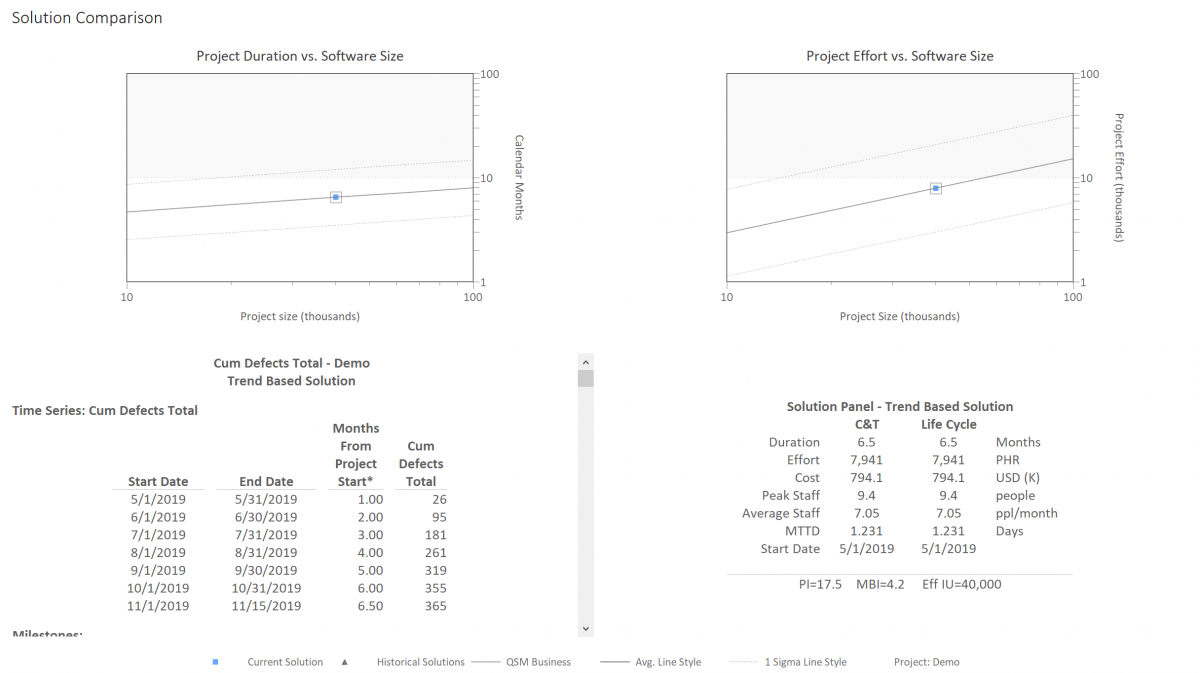
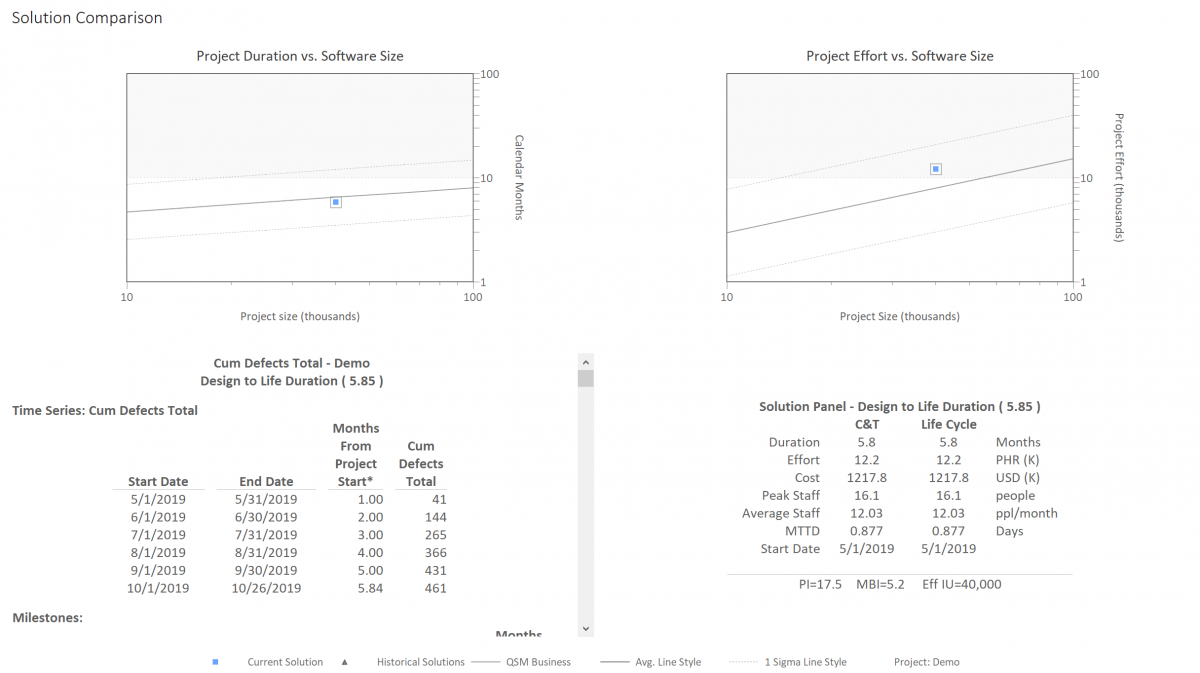
Let’s look at some examples.  In the charts below, regression trend lines for schedule and effort vs. size were developed from the QSM software project database.  The darker center lines represent average schedule and effort outcomes as delivered product size grows.  The lighter lines are plus and minus 1 standard deviation.  Roughly 2/3 of the projects in the database fall between the standard deviation lines.  Note the scale on the axes, which is log-log.  This is because the relationship between the amount of software developed and schedule duration or effort is non-linear. 

Software Project Solution
6.5 Month Solution

Software Project Solution
5.85 Month Solution

Blog Post Categories 
Estimation Schedule Effort

Are Your Software Projects Too Small?

We hear a lot about software projects that are too large or attempt to do too much in too short of a time.  They are very visible and negatively impact both budgets and careers in a not positive manner when they fail.  Small projects may fly under the radar.  This is a mistake.  Most IT projects aren’t large undertakings like Healthcare.gov; rather, they are enhancements and customizations to already existing software systems and account for the majority of most enterprises’ software budget.  Planning these projects to be optimally productive is an area in which most companies can realize the greatest returns.

How do you know what is the optimal amount of software to develop in a project?  In a newly published software benchmark study QSM analyzed productivity, cost/effort, and time to market of a large sample (over 600) of business IT projects that have recently completed.  The projects were divided into quartiles based on the amount of software they developed or customized, which were then compared to each other.  Fully ¼ of the projects were smaller than 3,200 implementation units in size or 68 function points for projects that used that size measure.  Projects in this quartile had a median productivity of 200 IU per staff month or 5 function points per staff month.  The median duration of these projects was slightly more than 3 months. The second quartile contained projects from 3,200 IU up to 8,000 (or 69 to 149 function points).  These projects had a median productivity of 377 IU per staff month (or 7.62 function point per staff month) and lasted a little more than 5 months.  This is a productivity improvement of 89%.  The smaller projects were markedly less productive.  So, simply by bundling software work into larger packages there are significant efficiencies to be gained.

Blog Post Categories 
Estimation Sizing Productivity

Estimating Program Increment Capacity in Scaled Agile (SAFe)

Scaled Agile (SAFe) is a methodology that applies Agile concepts to large complex environments.  QSM recently worked with an organization that had implemented SAFe to develop an estimation methodology specifically tailored to it.  This article discusses how it was implemented.

Software estimation typically addresses three concerns: staffing, cost/effort, and schedule.  In the SAFe environment, however, development is done in program increments (PI) that in this case were three months in duration with two-week sprints throughout.  Staffing was set at a predetermined level and varied very little during the PI.  Thus, the three variable elements that are normally estimated (staff, cost/effort, and schedule) had already been determined in advance.  So, our job was done, right?  Wrong!  What remained to be determined was capacity: the amount to be accomplished in a single PI.  And that was a very sore “pain point” for the organization. 

Blog Post Categories 
Agile Estimation Capacity Planning

Software Project Size and Road Construction

Software Project Size and Road ConstructionI have been a software project estimator for 20 years.  Like many people who have worked a long time in their profession, I find myself applying my work experience to other events in my life.  So, when a family member tells me that he or she will be back from a trip into town at 3:30, I look at their past performance (project history) and what they propose to do (project plan) and add an hour.  Usually, I am closer to the mark than they are.

Blog Post Categories 
Software Sizing Estimation