Productivity

Productivity

Has Software Productivity Declined Over Time?

Peter Hill of ISBGS poses an interesting question:

Has software productivity improved over the last 15 years? What do you think? Perhaps it doesn't matter as long as quality (as in defect rate) as improved?

Two widely used productivity measures are Function Points/Person Month and QSM's PI (or productivity index). To answer Peter's question, I took a quick look at 1000 medium and high confidence business systems completed between 1996 and 2011. Here's what I found:
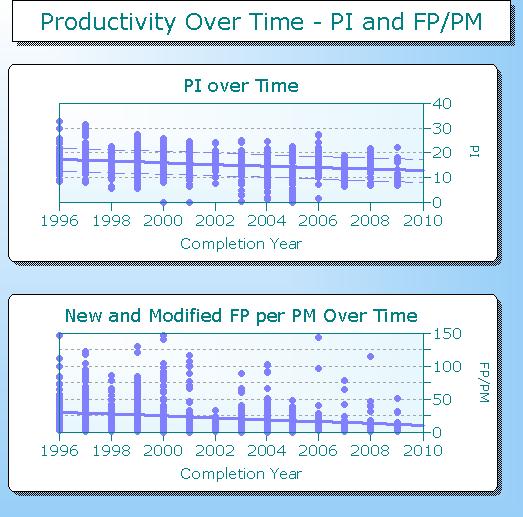
Productivity over time chart


Whether we look at PI or FP/PM, the story's the same - on average, productivity has actually decreased over time.  What could be causing this? One possible explanation is the correlation between measured productivity and the volume of delivered functionality. As the next chart shows, regardless of the metric used average productivity increases with project size:
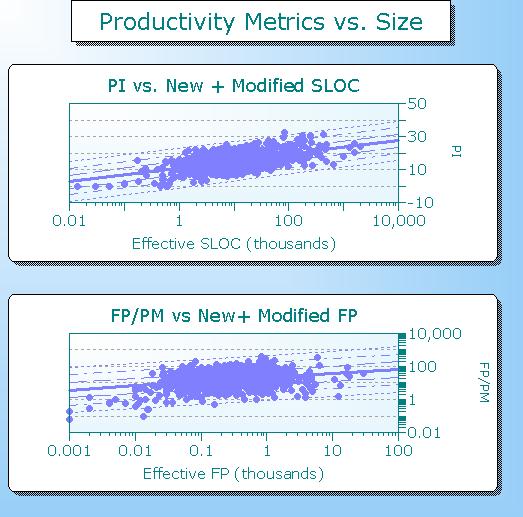
Chart of productivity vs. size


Which led me to wonder: what has happened to average project size over time? Again, regardless of whether the delivered functionality was measured in SLOC or Function Points, the story was the same: projects are getting smaller.
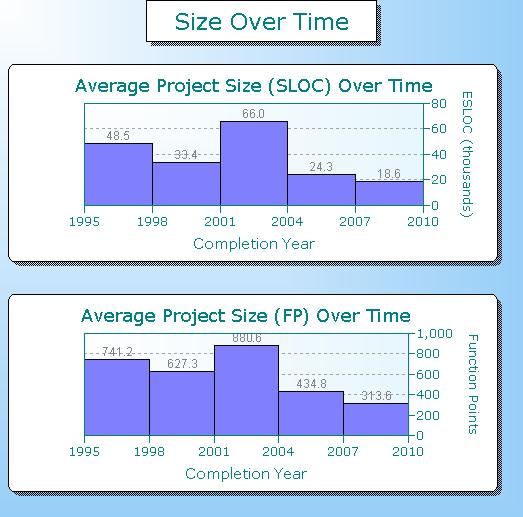
Chart of project size over time


Peter's question is a good example of why we often need more than one metric to interpret the data. More on that topic coming up shortly!


Blog Post Categories 
Productivity Software Mythbusters

Part IV: Duration, Team Size, and Productivity

For many projects, duration is just as important a constraint as cost. In this installment we will tackle the question:  How do changes to team size affect project duration and the resulting productivity?  Once again we will use our database of business applications completed since January, 2000.

Continue reading...

Blog Post Categories 
Team Size Productivity

Part III: How Does Duration Affect Productivity?

This week we turn to another question triggered by the Performance Benchmark Tables: how does duration affect productivity? To many managers, project schedule and cost are equally important. There are significant tradeoffs involved: if the project takes too long, important market opportunities may be lost. But adding people to compress the schedule can drive up cost dramatically. For this reason, QSM uses a productivity metric that explicitly accounts for duration: the Productivity Index (or PI). Unlike ratio based productivity measures, the PI is a three dimensional measure that adds duration to the traditional size/effort equation. It explicitly accounts for the distinctly non-linear relationships between size, effort, and time.  To see the benefits of this approach, let’s look at how project duration relates to simple (SLOC/effort) productivity.

Continue reading...


Blog Post Categories 
Productivity

Part II: Team Size and Productivity

In Part I of this series, we demonstrated that average productivity (effective size/effort) increases with project size. This relationship holds true across the size spectrum whether we’re talking about projects in the very small range or projects that deliver a million lines of code. Above this cutoff, the sample size is too small to be definitive.

But productivity isn't the only metric that increases with project size. On average, large projects use more effort, take longer, and use bigger teams.  How can these results be reconciled with previous studies which conclude that the large team strategy results in lower productivity? It would seem that we have a contradiction on our hands.


Blog Post Categories 
Productivity

The Size-Productivity Paradox, Part I

From time to time, questions from clients get us thinking:

After yesterday's Web presentation on the QSM Benchmarking Consortium, I went to your Web site and found the paper "Performance Benchmark Tables." I noticed the delivery rates in both SLOC/PM and FP/PM numbers increase as average project size increases. This seems counterintuitive: are the Performance Benchmark Tables correct?

That's a great question. Our data definitely shows an upward trend in productivity as application size increases. This is true whether we use measures like QSM's PI (productivity index) or ratio based productivity measures (SLOC or FP per person month of effort). The QSM industry benchmark trends behave similarly: as projects get larger, average productivity increases as well.

Paul Below recently took another look at productivity data using several popular statistical software packages. The question he was trying to answer was, “Does productivity (measured as SLOC/PM) always increase with system size, or could the size-productivity relationship actually behave differently in certain regions of the size spectrum?" To answer this question he used something called residuals to evaluate the size/productivity regression trend.

Blog Post Categories 
Productivity