I was recently reading an article by Moira Alexander titled “Why Planning Is the Most Critical Step in Project Management” and I was stuck by her observation that one of the primary reasons that projects fail is because they commit to unrealistic expectations. In my 35 years of experience, I believe this is the number one reason projects fail. Yet it is competence that few organizations or product owners ever get good at.
Today there are good simulation tools that make it simple to establish realistic project boundaries. The results can be used effectively to communicate and negotiate expectations with clients.
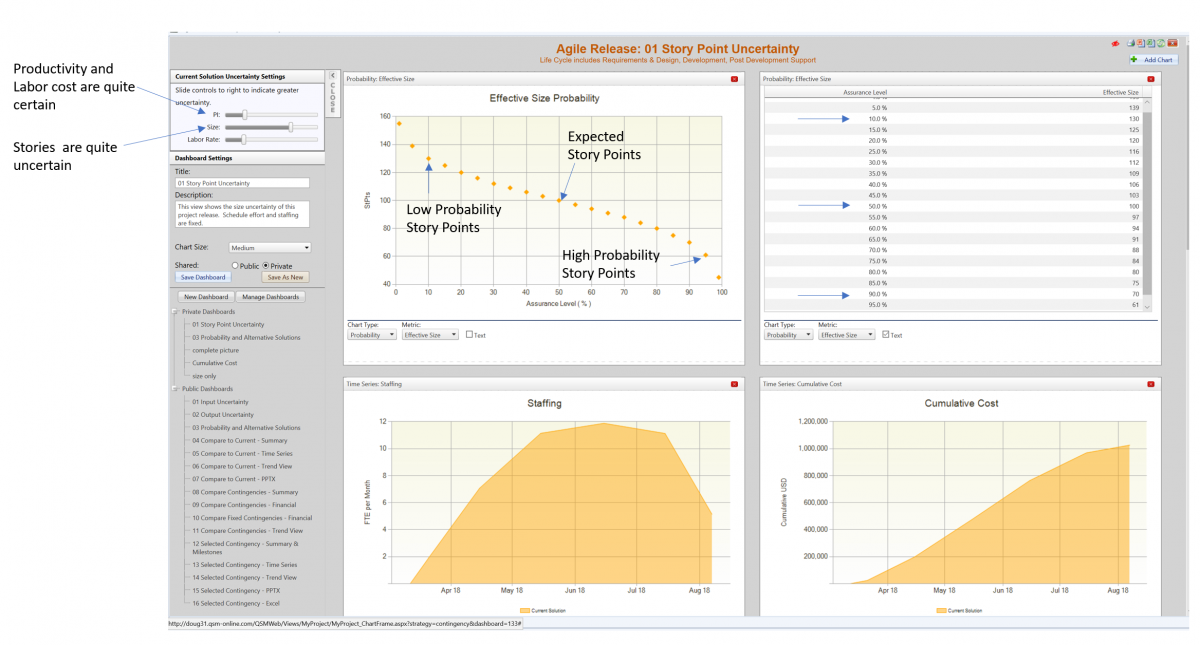
For example, imagine that you are a product owner planning out your next release. Your team of 10 people has been working on a 5-month release cadence. A backlog refinement has shown that there are approximately 100 story points to be completed in this release. The project plan is shown in the figure below.

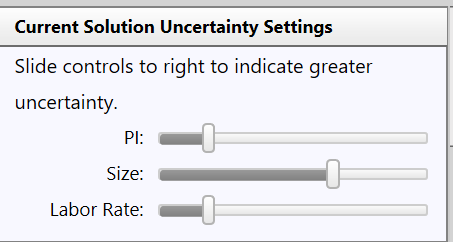
However, there are some uncertainties and we need to deal with them in a realistic way. Since the schedule and the team size are fixed, the only area that can give is the functionality. Simulations are a great way to quantify uncertainty. In our case, we are confident in our team’s productivity and labor cost, but we are somewhat more uncertain about the new capabilities in this release. It is easy to adjust the uncertainty settings and run a business simulation. The uncertainty slider bars are in the image below.

The user-defined uncertainty settings change the slope of the story point probability curve. It is displayed in the top left quadrant of our chart. Here is how one interprets and uses the probability data. Our estimate is 100 story points. It is positioned in at the center of the graph at the 50% probability level. It is the expected value estimate. Now we know that unexpected things happen to projects which effect performance. Given our estimates of uncertainty, we are 90% confident that we will deliver at least 70 story points (our lower limit). Our customer can absolutely count on this level of performance. If things go better that we anticipate, then there is a 10% chance that we could deliver as many as 130 story points (our upper limit). The customer shouldn’t expect this, but there is a small chance it could happen.
One nice aspect of simulation technology is that it is scalable. It can be applied to portfolio level plans using epics, program increment plans using features or release plans using stories or story points. So it can support multiple levels within the organization.
Probability charts are perfect for setting expectations. Your customers will know the absolute lower limit and have an appreciation for the upside potential. Everyone understands the realistic delivery range.
So next time you gear up for a new release, don’t get caught short in the expectations setting game. Build your plan and communicate the realistic uncertainty. Everyone will be more satisfied at delivery time. Give it a try you’ll be surprised how well it works.
