There's a good fit between my total defect data and the plan but in the defects by category charts, the defect actuals for each category aren't tracking the plan very well. How can I fix this?
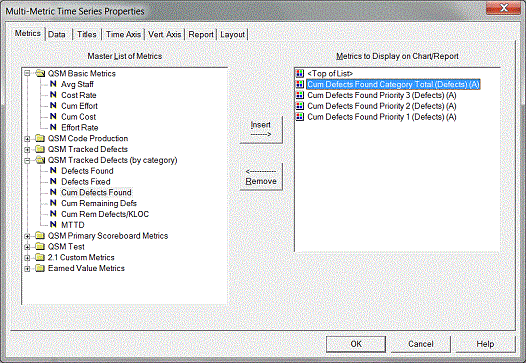
Chances are your defect category percentages need to be adjusted. To tune these percentages using your actual data, create a Multi-Metric Time Series Chart and insert a QSM Tracked Defects Category Total (Actual) metric for each defect category you're tracking:

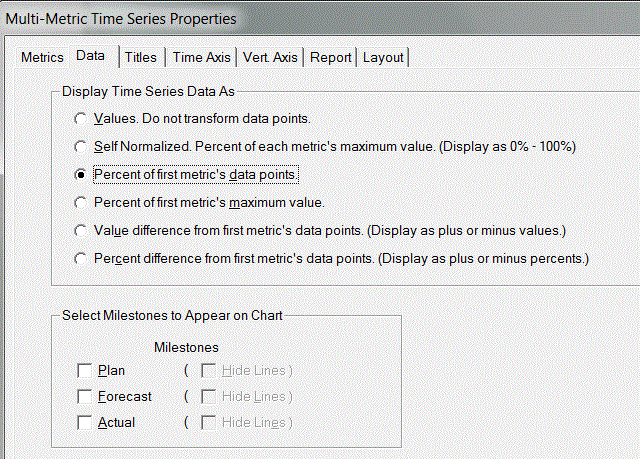
Next, right click on your chart to access the chart property tabs. On the Data tab, select "Percent of first metric's data points" and click OK to exit the dialog.

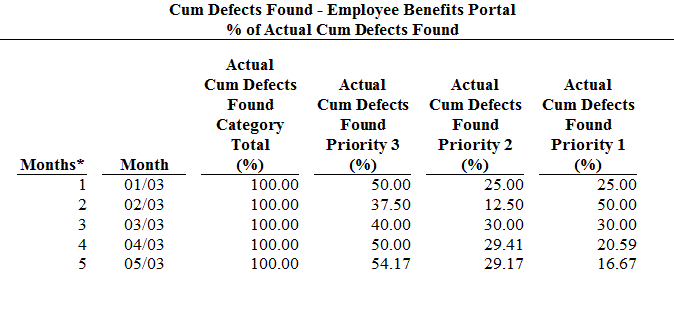
Next, toggle your Multi-Metric chart into report form:

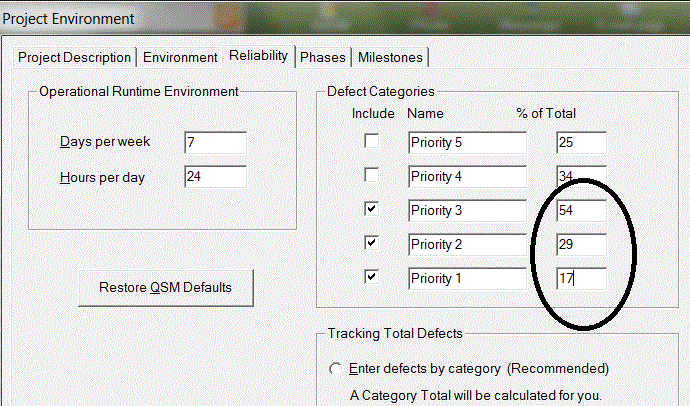
If the weekly or monthly values seem fairly consistent, you can simply use the latest % of total for each category. If you see a lot of variation, you may want to average the values - don't be afraid to experiment until you get the best visual fit! Enter the % for each category on the Reliability tab of the Project Environment dialog:

Once you return to the defects by category views, you should see a better fit between the plan and actuals.
