In all production environments, there exists a tension between competing outcomes. Four variables come to mind:
- Cost/Effort
- Schedule
- Quality
- Productivity
These do not exist independently of one another. Emphasizing any one impacts the others. For example, to compress a project’s schedule, additional staff is typically added which increases the cost. Larger team size also increases communication complexity within a project which leads to more defects (lower quality). The development of software presents a unique issue that may not be present or is at least more muted in manufacturing: non-linearity. Key examples of this are the relationships between cost/effort and schedule and the one between schedule and quality.
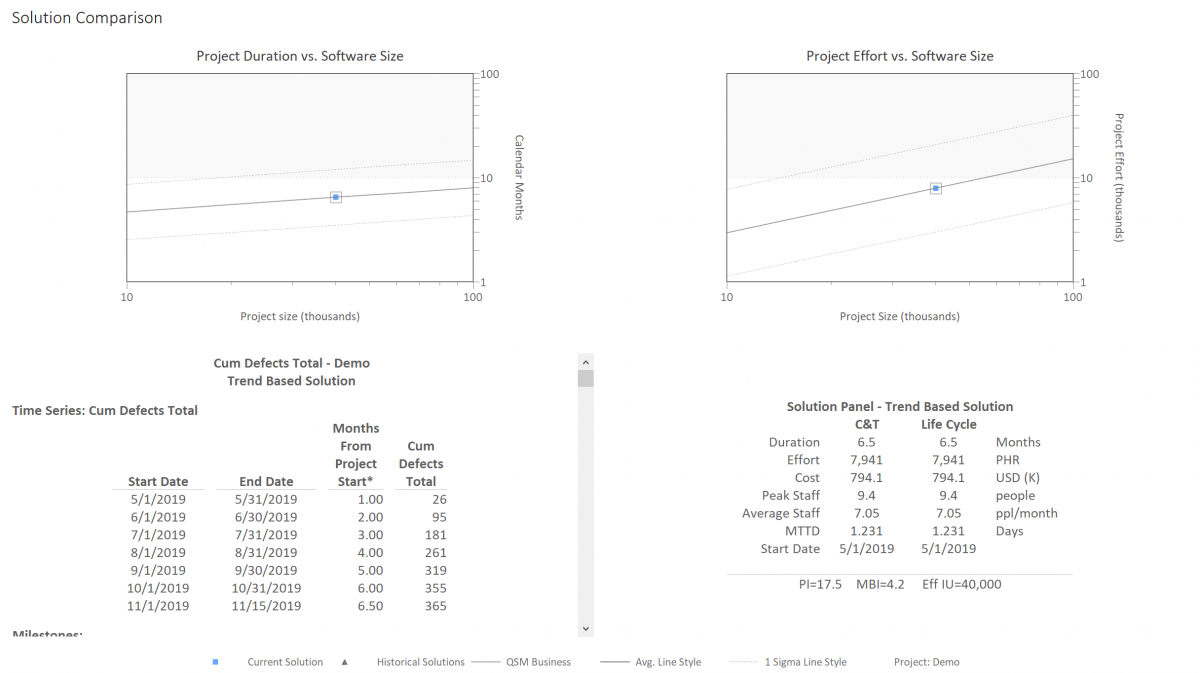
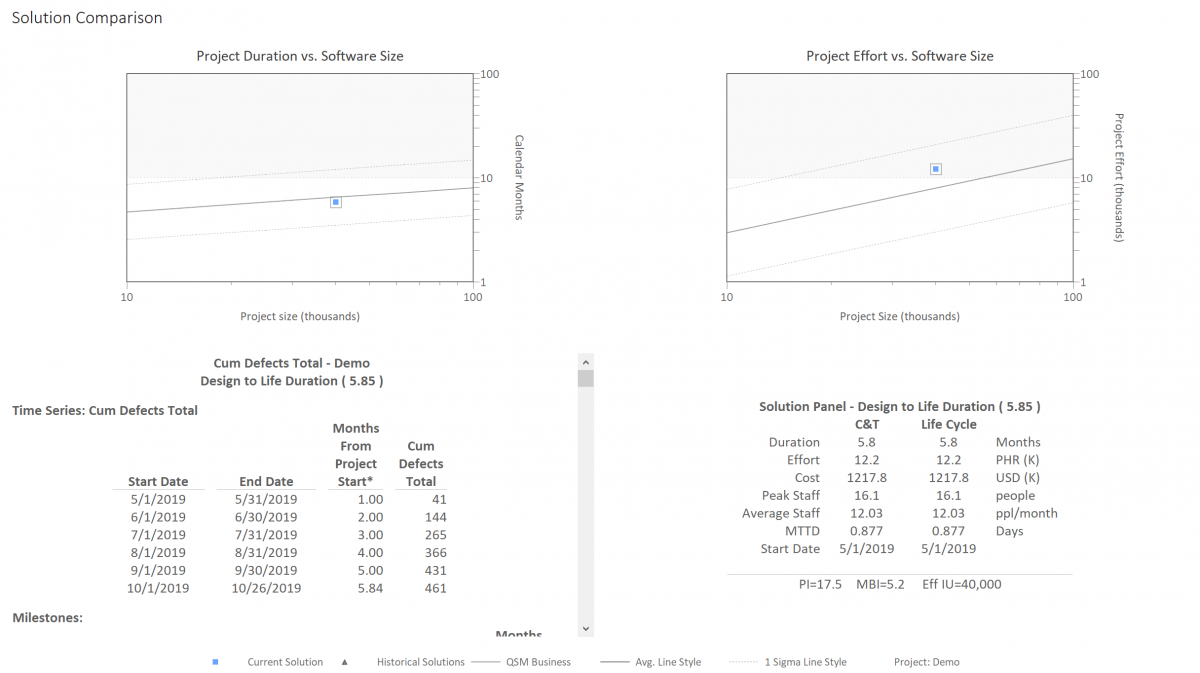
Let’s look at some examples. In the charts below, regression trend lines for schedule and effort vs. size were developed from the QSM software project database. The darker center lines represent average schedule and effort outcomes as delivered product size grows. The lighter lines are plus and minus 1 standard deviation. Roughly 2/3 of the projects in the database fall between the standard deviation lines. Note the scale on the axes, which is log-log. This is because the relationship between the amount of software developed and schedule duration or effort is non-linear.

6.5 Month Solution

5.85 Month Solution
The graphics above represent two alternatives for developing the same quantity of software. The first solution reflects average industry performance for projects of the given size (i.e., schedule and effort are on the average line). The second demonstrates what occurs when the schedule is reduced by 10% from 6.5 to 5.85 months. In these examples, cost is calculated using a blended labor rate of $100 per hour. Here is a summary of the results.

What is particularly notable is that the 5.85-month solution is still fairly close to the average duration and certainly well within the +/- 1 standard deviation lines. It is not an extreme solution (outlier). Yet a mere 10% reduction in schedule increases effort and cost by over 50% and defects by over 25%!
Using industry data to show how extremely sensitive cost, quality, and effort are to relatively minor changes in schedule is a powerful tool. The data clearly show how important it is to plan a project’s schedule carefully. This is where what-if modelling with a parametric tool such as SLIM-Estimate can be a real game changer by identifying potential trade-offs beforehand thus allowing the costs and benefits to be properly balanced.
