Effort

Effort

Practical Software Estimation Tips for Communicating with Business Leaders

How large is your project?
It’s projected to cost $2,000,000.
That’s cost. not size!

How large is your project?
We believe it will take 14 months to complete.
That’s schedule, not size!

How large is your project?
It’s going to be a 25-person project.
That’s staff, not size!

Software estimators often think of project size as what a project produces (features, stories, requirements, function points, or code). These are what a project has to create or account for in order to fulfill its mission. Business leaders, understandably, are more likely to visualize project size in terms of resources expended (cost, time to market, or FTE staff).  These competing definitions of “size” can produce confusion and ambiguity. Which leads us to Tip #1.

Tip 1

Be prepared to explain to business leaders how quantifying project size (as seen by an estimator) helps business leaders get more accurate estimates of the things that matter to them: cost, schedule, quality, and staffing. I find a graphic like the one below from SLIM-Estimate can be useful to illustrate the relationship between a project’s size (primarily of interest to development staff and project managers) and the major project management metrics of interest to the C-suite.

Blog Post Categories 
Estimation Cost Effort Sizing Schedule

Monitoring Software Project Progress by Money Spent Can Be Misleading

Sound financial practices are a core value of any successful enterprise; and should be.  It may come as a surprise that monitoring money spent against planned expenditures is not the best way to evaluate the progress of software projects.  The reason is simple:  by the time financial measures indicate that a project is off track, it is often too late to take effective corrective actions or identify alternative courses of action.

Here is an example that illustrates this.  Let’s take a hypothetical project plan with these characteristics:

  • Planned project duration of 1 year
  • Full time staff of 6 for the length of the project
  • Billing rate of $100/hour
  • 335 business requirements to complete
  • Project begins at the start of June and is scheduled to complete May 31 of the following year

According to this plan, the project should have a labor cost $1.245 million.  Now, using a software project monitoring tool, SLIM-Control, let’s see what the project looks like at the end of September. 

Software Project Cost

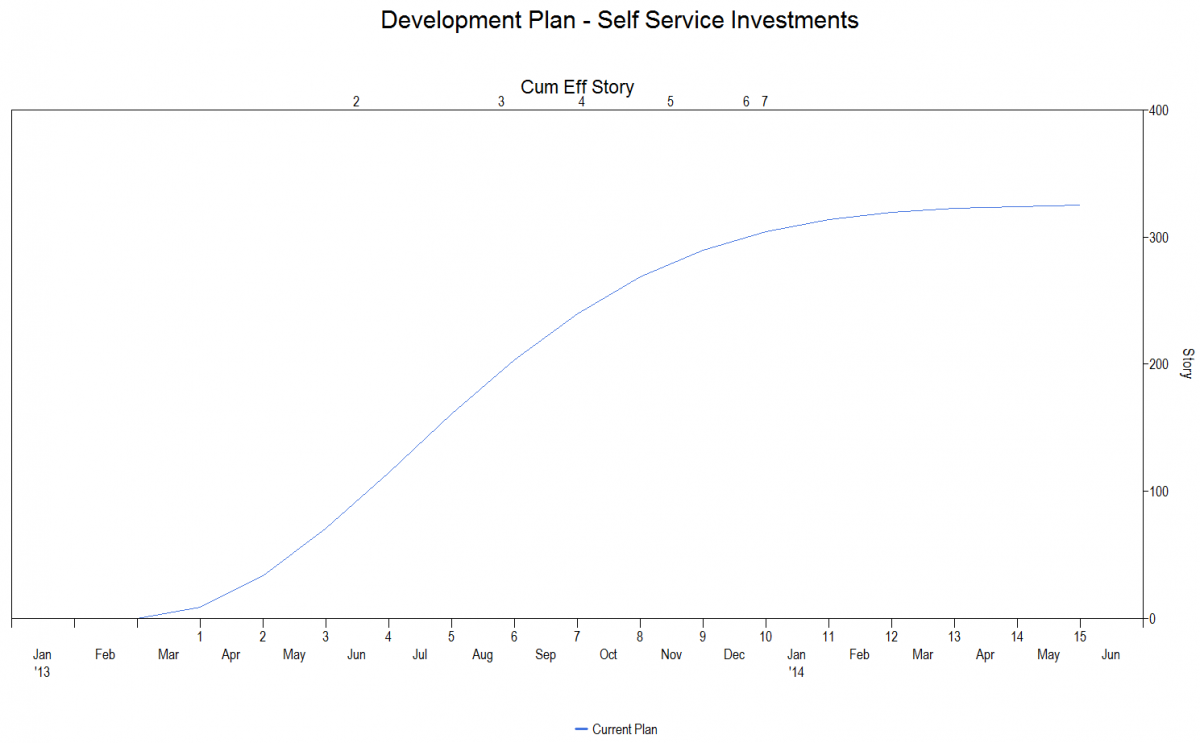
If we only look at money spent, the project is on track since planned and actual expenditures are exactly the same.  However, when we look at the progress of the actual work completed, a different story emerges.  The project got off to a slow start and the gap between what was planned and what has been delivered has increased every month.  Unless this is rectified, the project will last longer and cost more than originally planned.  Here is a forecast of what will happen if the current trend continues.  The project will complete over two months late and cost an additional $215,000.

Blog Post Categories 
Effort SLIM-Control Tracking

The Balancing Point between Project Cost and Schedule

In all production environments, there exists a tension between competing outcomes.  Four variables come to mind:

  • Cost/Effort
  • Schedule
  • Quality
  • Productivity

These do not exist independently of one another.  Emphasizing any one impacts the others.  For example, to compress a project’s schedule, additional staff is typically added which increases the cost.  Larger team size also increases communication complexity within a project which leads to more defects (lower quality).  The development of software  presents a unique issue that may not be present or is at least more muted in manufacturing:  non-linearity.  Key examples of this are the relationships between cost/effort and schedule and the one between schedule and quality. 

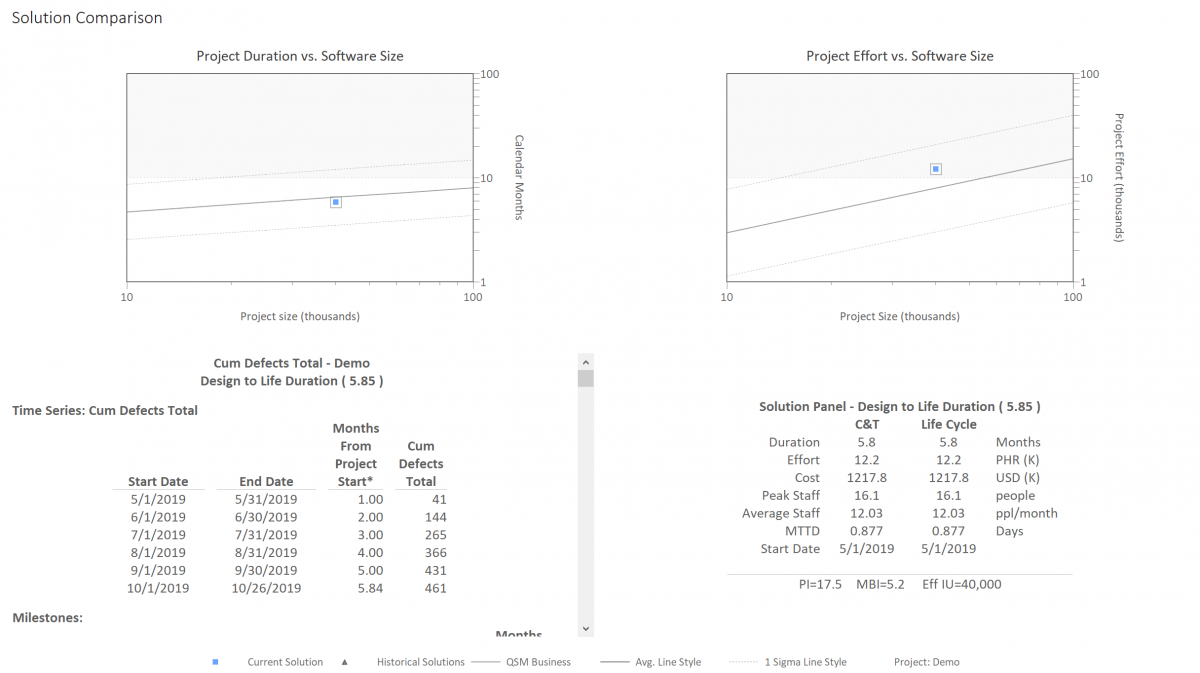
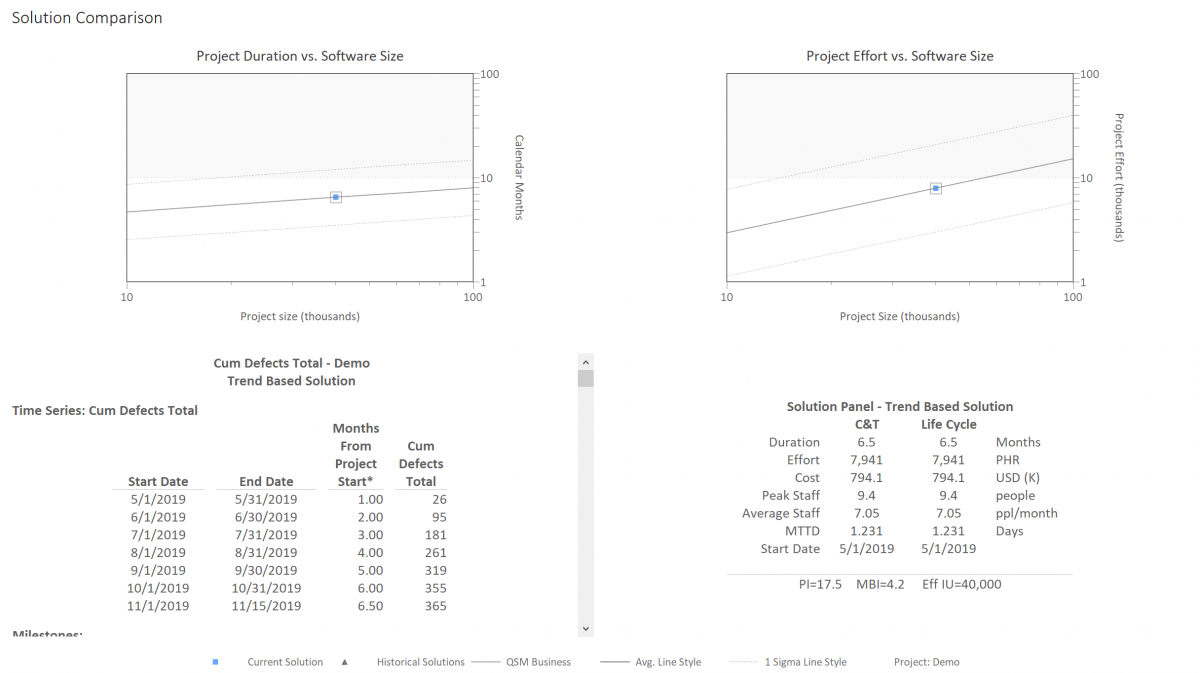
Let’s look at some examples.  In the charts below, regression trend lines for schedule and effort vs. size were developed from the QSM software project database.  The darker center lines represent average schedule and effort outcomes as delivered product size grows.  The lighter lines are plus and minus 1 standard deviation.  Roughly 2/3 of the projects in the database fall between the standard deviation lines.  Note the scale on the axes, which is log-log.  This is because the relationship between the amount of software developed and schedule duration or effort is non-linear. 

Software Project Solution
6.5 Month Solution

Software Project Solution
5.85 Month Solution

Blog Post Categories 
Estimation Schedule Effort

New Article: Measuring Effort and Productivity of Agile Projects

Agile Effort

QSM recently published the seventh and final article in the QSM Agile Round Table series. The QSM Agile Round Table was formed to discuss the role of estimation in agile environments. QSM customers shared their questions, challenges, and experiences on the relevance and benefits of scope-based estimation in an agile environment. Participants had several questions about measuring effort and productivity, and whether there are special issues around how to define and collect these metrics in an agile environment. In this article, Andy Berner identifies best practices for measuring effort and productivity in agile and discusses how the two are related.

Read the article!

Blog Post Categories 
Articles Agile Productivity Effort

New Article: Avoiding a Doomed Software Project by Checking the Staff Build-Up Plan

Forecasting from Defect Signals

The staff build-up plan defines how many, what kind, and when staff are needed for the entire project. Too many or too few, bringing them on too early or late, employing the wrong mix of expertise or experience - avoiding all these pitfalls with a staff build-up plan will ensure a successfully staffed project. Reviewing proposals for a complex project, such as major software development or support, is a challenging activity. Since labor is the major cost and feasibility determinant for such projects, requiring the submission of a "staff build-up plan" and verifying its realism is crucial in determining whether a proposed project can realistically succeed. In this article for Contract Management Magazine, QSM's Gene Shuman identifies the key components of an effective staff build-up plan.

Read the full article!

Blog Post Categories 
Effort Project Management

The "Typical Software Project" Over Time

What does a typical software project in the QSM historical database look like, and how has “what’s typical” changed over time? To find out, we segmented our IT sample by decade and looked at the average schedule, effort, team size, new and modified code delivered, productivity, language, and target industry for each 10 year time period.

The QSM benchmark database represents:

  • 8,000+ Business projects completed and put into production since 1980.
  • Over 600 million total source lines of code (SLOC).
  • 2.6 million total function points.
  • Over 100 million person hours of effort.
  • 600+ programming languages.

During the 1980s, the typical software project in our database delivered 154% more new and modified code, took 52% longer, and used 58% more effort than today’s projects.   The table below captures these changes:

Blog Post Categories 
Team Size Languages QSM Database Effort

Effort: What's Behind that Number?

Effort seems like a metric that's very straightforward, but there is a lot of complexity here, particularly if you are performing benchmark analysis. Recently, I was tapped to help out with a benchmark assessment. One of the metrics that the customer wanted to analyze was effort per function point. "Effort" on its own is very vague, and while the customer might know which phases or activities his organization uses, I can't be sure that definition will match what I think he wants. In order to effectively benchmark, we need to make an apples-to-apples comparison by examining what is really behind the effort number, so it was necessary to send the client phase and activity definitions. 

Here are some helpful definitions to help you understand which activities are included in each phase: 

Concept DefinitionThe earliest phase in the software life cycle, where complete and consistent requirements and top-level, feasible plans for meeting them are developed.

The objectives of this phase are to develop a complete and technically feasible set of requirements for the system and to formulate the top-level approach and plan for their implementation.  Typical products of these activities include:

Blog Post Categories 
Benchmarking Effort

Tuning Effort for Best in Class Analysis and Design

After reading Best Projects/Worst Projects in the QSM IT Almanac, a SLIM-Estimate® user noted that the Best in Class Projects expended around 28% of their total project effort in analysis and design (SLIM Phase II) compared to 10% for the Worst in Class Projects. She wanted to know how she could tune her SLIM-Estimate templates to build in the typical best in class standard for Analysis and Design.

In SLIM-Estimate, effort and duration for phases I and II are calculated as a percentage of Phase III time and effort. To create a template for estimating phases II and III that will automatically allocate 28% of total project effort to analysis and design (Phase II), follow these simple steps.

  • From the Estimate menu, select Solution Assumptions.  Make sure the “Include” check boxes for Phases II and III are selected.  Then click on the Phase Tuning tab.
  • Click on the tab for Phase II.  (If you have previously customized the phase names, the default name for Phase II will reflect that).
  • Click on the Manual button under Effort, and enter 28% for the effort percent.

That’s it. Your estimates based on this template will now automatically allocate 28% of total project effort to Analysis and Design (Phase II).

This procedure assumes that your estimates will be for SLIM Phases II and III, which, we have found, is the typical scope for most project estimates. However, if your estimates include Phases I and/or IV, you may have to increase the effort percent a bit to achieve the desired result.

Blog Post Categories 
SLIM-Estimate Tips & Tricks Effort