Part II: Small Teams Deliver Lower Cost, Higher Quality
This is the second post in a three part investigation of how team size affects project performance, cost, quality, and productivity. Part one looked at cost and schedule performance for Best in Class and Worst in Class IT projects. For this study, Best in Class projects were those that delivered more than one standard deviation faster, but used more than one standard deviation less effort than the industry average for projects of the same size. A key characteristic of these top performing projects was the use of small teams: median team size for best in class projects was 4 FTEs (full time equivalent) people versus 17 FTEs for the worst performers.
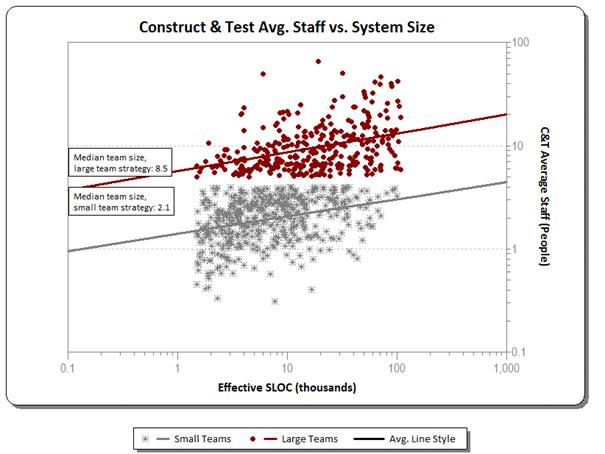
What is the relationship between team size and management metrics like cost and defects? To find out, I recently looked at 1060 medium and high confidence IT projects completed between 2005 and 2011. These projects were drawn from the QSM database of over 10,000 completed software projects. The projects were divided into two staffing bins:
- Small team projects (4 or fewer FTE staff)
- Large team projects (5 or more FTE staff)

These size bins bracket the median team size of 4.6 for the overall sample, producing roughly equal groups of projects that cover the same size range. Our best/worst in class study found a 4 to 1 team size ratio between the best and worst performers.
