Last week, Carl Erickson of Atomic Spin referenced a study performed by Doug Putnam several years ago:
A study done by consultancy QSM in 2005 seems to indicate that smaller teams are more efficient than larger teams. Not just a little more efficient, but dramatically more efficient. QSM maintains a database of 4000+ projects. For this study they looked at 564 information systems projects done since 2002. (The author of the study claims their data for real-time embedded systems projects showed similar results.) They divided the data into “small” teams (less than 5 people) and “large” teams (greater than 20 people).
To complete projects of 100,000 equivalent source lines of code (a measure of the size of the project) they found the large teams took 8.92 months, and the small teams took 9.12 months. In other words, the large teams just barely (by a week or so) beat the small teams in finishing the project!
Since then, QSM has performed several studies investigating the relationship between team size and metrics like project scope, productivity, effort/cost, and reliability. The results have been surprisingly consistent regardless of application domain, technology, or year group. I’ll be reviewing what we found in a series of posts.
Best in Class Software Projects Use Small Teams
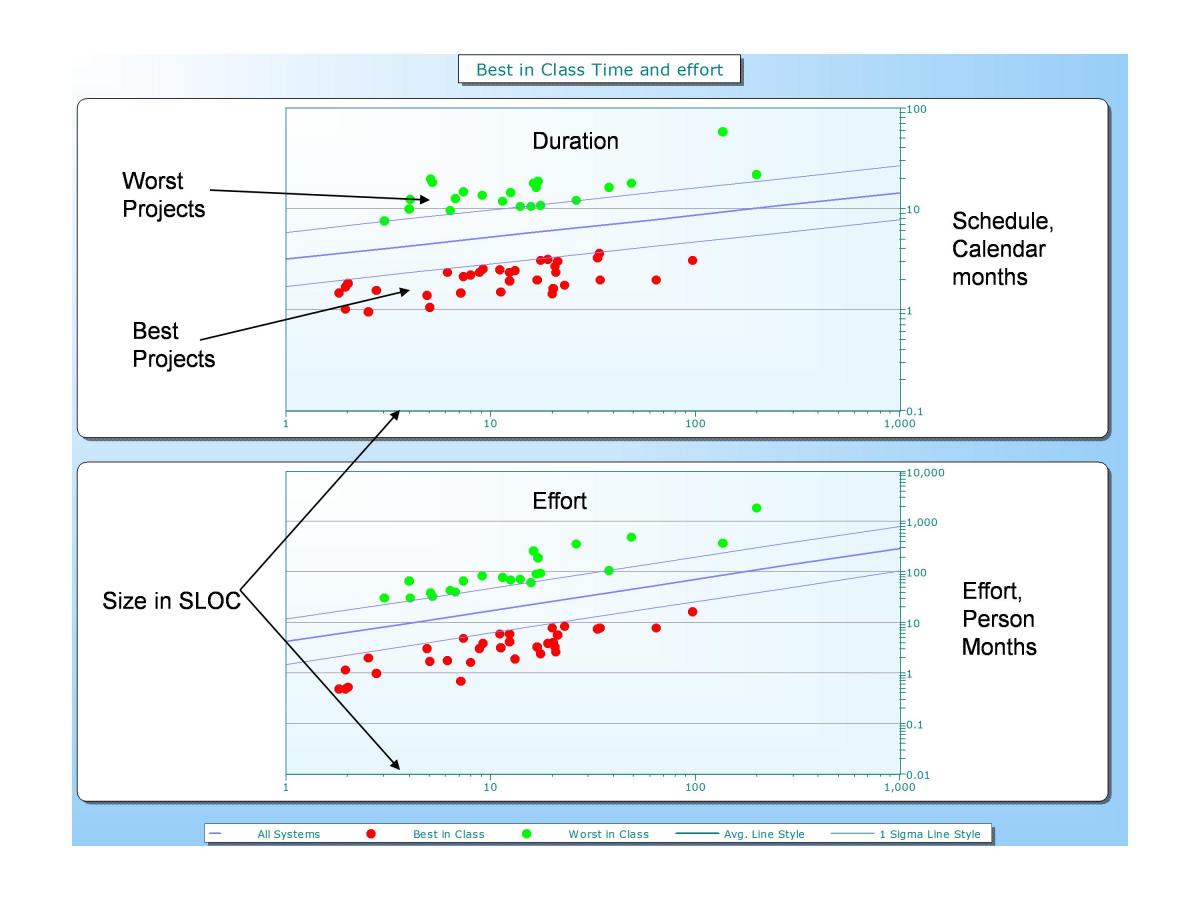
 In a study performed for our 2006 IT Almanac, Don Beckett examined the characteristics of Best and Worst in Class projects. The one thing that jumped out almost immediately was the influence of team size. To identify top and bottom performers, he ran regression fits for effort and schedule vs. project size through a sample of nearly 600 medium and high confidence IT projects completed between 2001 and 2004. These projects were drawn from the QSM database of over 10,000 projects and included a broad range of languages, technologies, development environments, countries, industries, and project types.
Using the plus- and minus- one standard deviation lines for schedule and effort as boundaries, projects above the plus one σ line became our Worst in Class sample. These poor performers took significantly longer and used more effort than the majority of projects in our sample. How much worse were they? Worst in class performers took longer and used more effort than about 84% of the sample. Projects below the lower 1 sigma lines for effort and schedule became our Best in Class projects.

The differences between the two groups were striking. On average, Best in Class projects delivered 5 times faster and used 15 times less effort than Worst in Class projects.
What could be causing the disparity in schedule and effort/cost performance between best and worst in class projects? The characteristic that stood out from Don's analysis was team size. Best in Class projects used smaller teams (over 4 times smaller, on average) than the worst performers.
This is the first in a series of posts that will look at the effect of team size on project performance, cost, schedule, and reliability from a variety of perspectives. The next post in the series will review a repeat of Doug’s team size study using a sample of 1060 IT projects completed between 2006 and 2011.
Read more QSM blog posts about team size.
