- Home
- Frequently Asked Questions
- <GENERAL FAQ>
- Defects (MTTD)
- Frequently Asked Questions - Defects (MTTD)
Frequently Asked Questions - Defects (MTTD)
My current plan is extremely inconsistent with my actual data. For instance, the project started a year late and has already slipped by almost 15 months. Using my original plan, the actual defect data yields a defect tuning factor of 2000% when I run the Defect Tuning Calculator function.
Is the plan being factored into the defect tuning calculations? If so, can significant variation between the plan and the actuals result in an incorrect tuning factor?
When looking for the best tuning factor, SLIM-Control must make some assumptions in order to generate a set of theoretical defect curves and find the one that best fits your actual data. If these assumptions are incorrect (for example, if either the expected phase 3 duration or expected effort are wrong) then any calculations based on these assumptions will be affected.

Before running the Defect Tuning Calculator, it’s a good idea to review the current plan to ensure reasonable consistency with your actual data. If your actuals have diverged significantly from the current plan, it should be updated before defect tuning is performed. To update the current plan, run a forecast, make the forecast the current plan, then re-run the Defect Tuning Calculator.
The planned MTTD value shown on my graph for the final month of phase 3 is not the same as the value reported in the Project Profile report and the consistency report for my Phase 3 MTTD. It appears to be slightly higher in the reports. Why?
The value displayed on graphs is the average MTTD rate for the final month of phase 3, but the MTTD value reported in the reports represents the planned MTTD at the end of phase 3. You should expect this value to be somewhat higher than the average value for the entire month, because the theoretical MTTD is always improving (getting larger) as time progresses.
My actual defect data points don't show up on the defect remaining and defect remaining/sloc reports and graphs. Why not?
Before we can calculate and display the number of errors remaining, we must know the forecasted number of errors in the system. Planned defects remaining is the difference between planned total defects and planned defects found at various points in time. Actual defects remaining are calculated by subtracting actual defects found from the forecasted total defects.
Therefore, the actual number of defects remaining will be shown only when a forecast exists.
I changed my runtime environment from 5 days to 7 days. I would have expected my MTTD value to get smaller because I am running the system longer. Why did my MTTD value get larger?
The MTTD value is simply the reciprocal of the monthly defect rate. Suppose the expected defect rate is 100 defects found during the last month of phase 3. This is a theoretical monthly rate number based on an average runtime environment. The MTTD for this month is therefore 1 month/100 errors or .01 months between defects.
Because it is difficult to think in terms of .01 months, you can specify a more intuitive MTTD time unit. If you select days, then .01 months is the same as .01 * 30 (roughly) or .3 days between defects (assuming you are running 7 days a week). However, if you are running only 5 days a week, then .01 months converts to (.01 * 20) or .2 days.
I sometimes get poor defect curve fits when running a forecast. What can I do to improve this?
Getting a good curve fit is important - the poorer the fit, the less confidence you will have in the projected new time for that set of data. The goodness of fit is particularly important during the latter stages of Phase 3 because defect data is weighted more heavily at that time. There are two things you can do to improve your defect curve fits:
1. Assess the reliability of early data points carefully. If you have little confidence in the earliest defect data, you should throw it out. Our theoretical defect data curve algorithm assumes defects are being captured from the start of Phase 3 in a consistent and systematic manner. In practice, however, systematic logging of defects is often not performed until around Systems Integration Test (71% of phase 3 duration). If your early defect data is very erratic, chances are those data points are unreliable. If you know (or suspect) this to be the case, exclude the unreliable data points from curve fitting and forecasting. Unreliable data introduces random noise into SLIM-Control's calculations and creates unreliable forecasts.
2. Try to determine the best tuning factor for your defect data. This is fairly easy to do once any early noisy data points have been discarded. There are two ways to get a handle on the defect tuning factor. You can use either one, or combine the two methods:
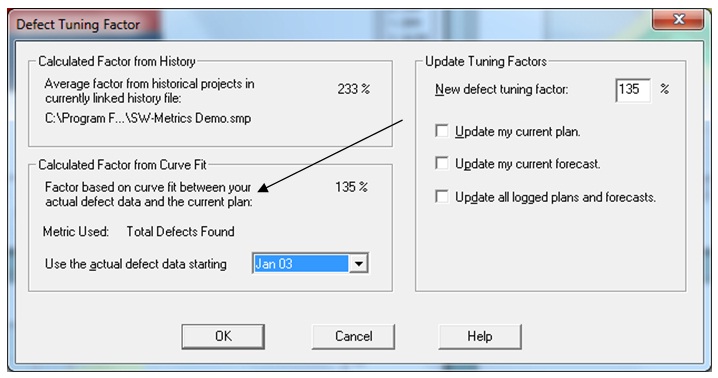
- The first method uses past projects to generate a historic defect tuning factor. You can use any similar projects captured in SLIM-DataManager. Individual defect tuning factors for each project can be displayed on DataManager’s Project List View by selecting Tools | Customize View Layout from the menu. To get the average Defect Tuning Factor for one or more completed projects, import them into SLIM-Control using the History | Load Projects menu item and then run the Defect Tuning Calculator. If you plan on using an average DTF from your history, you may wish to inspect the data and eliminate outliers to prevent distortion of the average.
- Once you have entered at least three actual total defect data points into SLIM-Control the Defect Tuning Calculator can also calculate a defect tuning factor from your actual defect data.
Once the expected defect total has been tuned to your history or actual data, you should see an improvement in your defect curve fits. If you’re tracking Defects Found by Category, here's one final step that will help ensure optimal curve fits:
- Tune the % of total defects for each category using your actual data. For more information on how to do this, see the FAQ entitled, "How Do I Tune My Defect Category Percentages?".
If you are still getting poor data fits after performing the steps outlined above, either try to determine the reasons or simply exclude defect data from the forecast curve fit.
My actual MTTD data points start at different times depending on whether there is a forecast being displayed. Why?
MTTD is not truly relevant until the entire system is integrated and functioning as a complete entity. For this reason, MTTD values are not shown until Systems Integration Test (which occurs at about 71% of phase 3).
Because we do not know the actual phase 3 time until the system is completed, we show actual MTTD data points starting at the same time as the plan unless there is a forecast present. Planned MTTD data points will always begin at about 71% of the planned phase 3 time.
Once a forecast is present, the actual/forecast MTTD data points will be shown starting at 71% of the forecasted phase 3 time.
I’d like my MTTD forecasts to reflect the number of test hours for each reporting period. How do I do this in SLIM-Control?
The Weighted MTTD option allows you to account for the actual hours spent testing each reporting period. Often the number of test hours fluctuates from month to month, causing large swings or "find and fix cycles" as test effort is directed to finding defects one period, then drops off as effort goes into fixing newly discovered defects during the next period. Using the Weighted MTTD option will smooth out these "find and fix" cycles, giving you a smoother defect curve. Be sure to click the box at the top of the Metric Definitions dialog box in order to display both active and inactive metrics.
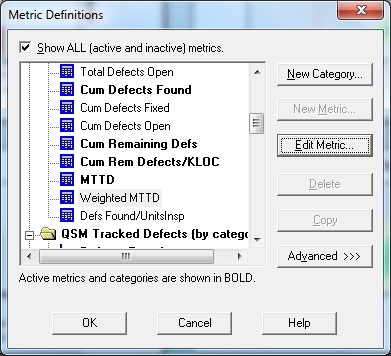
To use the Weighted MTTD metric, you must activate it by choosing Tools | Customize Metric Definitions from the menu. Locate the active defect metrics folder (Hint: the folder title will be bolded). If you don't see the metric, make sure you are displaying all active and inactive metrics. Scroll down and select the Weighted MTTD metric, then click the Edit Metric button:

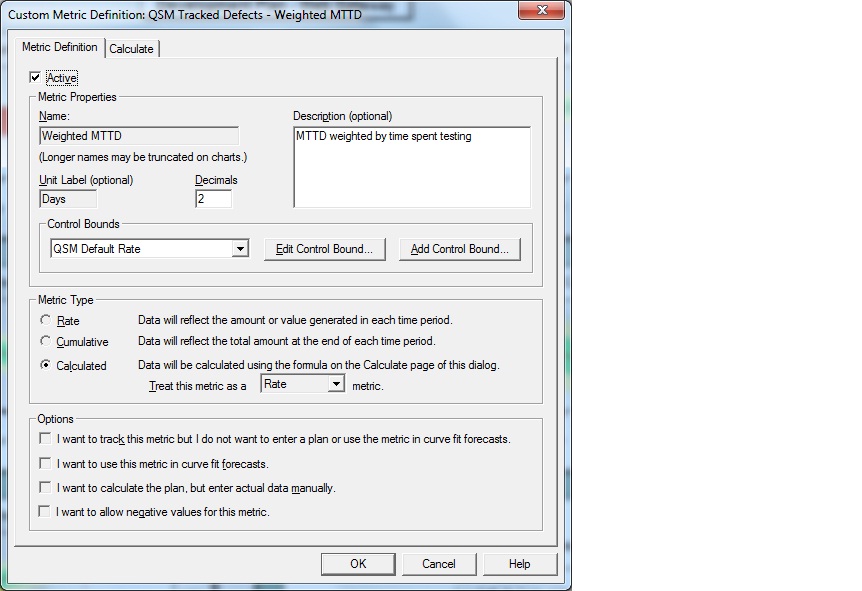
Activate the metric by checking the “Active” checkbox and click OK to exit.

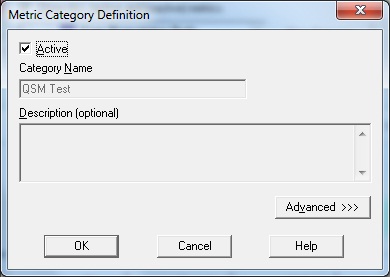
Next, activate the QSM Test folder. Note the lack of bold type – this category is inactive by default. Select the folder title and activate the category using the Edit Category button:

Click OK to save your changes and exit the Metrics Definitions dialogs.
The number of testing hours per reporting period should now appear on the Metrics tab of the Actual Data screen (select Control | Actual Data from the menu). As with all custom metrics, the testing hours field is appended to the list of standard metrics so you will need to scroll down to the bottom of the metric list to see the Test Hours field. This is where you will enter the actual hours spent testing for each reporting period.
