- Home
- Frequently Asked Questions
- <GENERAL FAQ>
- SLIM-Control
- Frequently Asked Questions - SLIM-Control
Frequently Asked Questions - SLIM-Control
There's a good fit between my total defect data and the plan but in the defects by category charts, the defect actuals for each category aren't tracking the plan very well. How can I fix this?
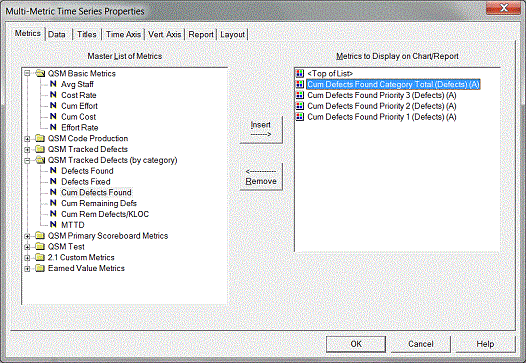
Chances are your defect category percentages need to be adjusted. To tune these percentages using your actual data, create a Multi-Metric Time Series Chart and insert a QSM Tracked Defects Category Total (Actual) metric for each defect category you're tracking:
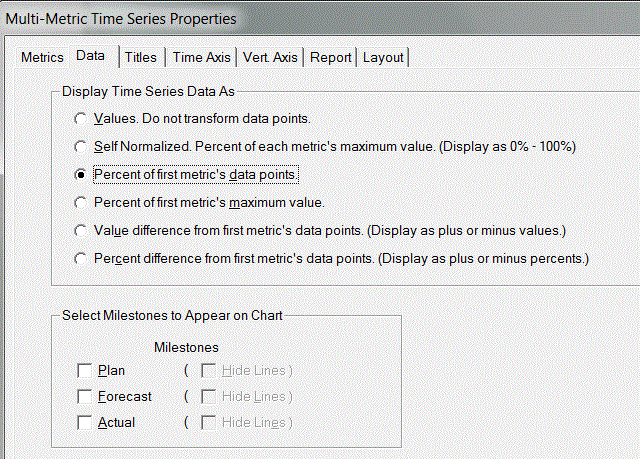
Next, right click on your chart to access the chart property tabs. On the Data tab, select "Percent of first metric's data points" and click OK to exit the dialog.
Next, toggle your Multi-Metric chart into report form:
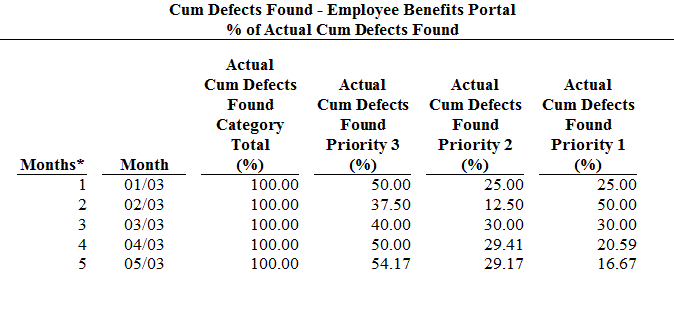
If the weekly or monthly values seem fairly consistent, you can simply use the latest % of total for each category. If you see a lot of variation, you may want to average the values - don't be afraid to experiment until you get the best visual fit! Enter the % for each category on the Reliability tab of the Project Environment dialog:
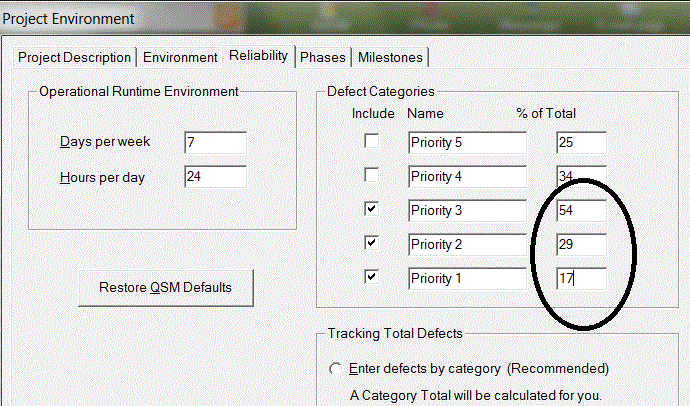
Once you return to the defects by category views, you should see a better fit between the plan and actuals.
Can I use the forecast function to explore various staffing options?
When you run a forecast, SLIM-Control bases the future staffing profile on the peak staff and staffing shape defined in the current plan.
While Phase 3 is ongoing, run a tradeoff forecast to see the impact of increasing or decreasing staff and apply any resulting schedule tradeoff to your existing forecast. To run a tradeoff forecast, select Control | Tradeoff Forecast… from the menu.
Once Phase 3 has completed, use the maintenance forecast to evaluate staff tradeoffs. The maintenance forecast can only be performed during Phase 4. To run a maintenance forecast, select Control | Run Forecast… from the menu.
My current plan is extremely inconsistent with my actual data. For instance, the project started a year late and has already slipped by almost 15 months. Using my original plan, the actual defect data yields a defect tuning factor of 2000% when I run the Defect Tuning Calculator function.
Is the plan being factored into the defect tuning calculations? If so, can significant variation between the plan and the actuals result in an incorrect tuning factor?
When looking for the best tuning factor, SLIM-Control must make some assumptions in order to generate a set of theoretical defect curves and find the one that best fits your actual data. If these assumptions are incorrect (for example, if either the expected phase 3 duration or expected effort are wrong) then any calculations based on these assumptions will be affected.
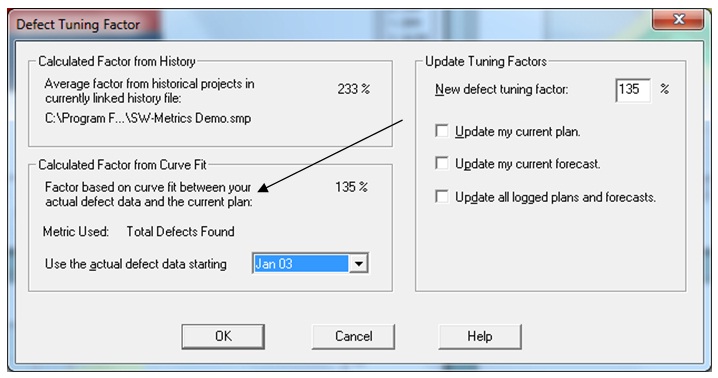
Before running the Defect Tuning Calculator, it’s a good idea to review the current plan to ensure reasonable consistency with your actual data. If your actuals have diverged significantly from the current plan, it should be updated before defect tuning is performed. To update the current plan, run a forecast, make the forecast the current plan, then re-run the Defect Tuning Calculator.
Sometimes, one or more of the menu items in SLIM-Control are grayed out and I'm not sure why.
Grayed out menu options generally denote features that will not become available until some condition has been satisfied. Here are some of the most common reasons a menu option may be unavailable:
1. You're trying to edit a QSM Default custom metric or control bound. Since QSM default custom metrics and control bound definitions cannot be edited, the options for these metrics are grayed out. You can, however, copy a QSM default metric or control bound definition and edit the copy.
2. You're trying to enter actual data for a metric that has not started yet or is complete. Before you can enter actual data for a metric, you must first enter an actual start date for that metric. Likewise, once you've entered an actual end date for a metric, you will no longer be able to enter actual data for that metric.
3. You're trying to set a start or end date for a metric that is tied to a phase: Start and end date fields for planned staffing/effort are disabled because staffing and effort data is always tied to a specific phase. For example, phase 2 effort begins on the first day of phase 2 and ends on the last day of phase 2. Start/end dates for each phase are defined on the Phases tab of the Plan property sheet (Control | Plan Data).
Start dates for Defect metrics are customizable, but defect end dates are disabled because they coincide with the end of the life cycle.
4. You're trying to enter a start or end date for an inactive phase. On the Plan | Phases tab, planned start or end dates can only be entered for active phases. To view/edit the active phases for the project, select Tools | Customize Project Environment and select the Phases tab.
My actual defect data points don't show up on the defect remaining and defect remaining/sloc reports and graphs. Why not?
Before we can calculate and display the number of errors remaining, we must know the forecasted number of errors in the system. Planned defects remaining is the difference between planned total defects and planned defects found at various points in time. Actual defects remaining are calculated by subtracting actual defects found from the forecasted total defects.
Therefore, the actual number of defects remaining will be shown only when a forecast exists.
I changed my runtime environment from 5 days to 7 days. I would have expected my MTTD value to get smaller because I am running the system longer. Why did my MTTD value get larger?
The MTTD value is simply the reciprocal of the monthly defect rate. Suppose the expected defect rate is 100 defects found during the last month of phase 3. This is a theoretical monthly rate number based on an average runtime environment. The MTTD for this month is therefore 1 month/100 errors or .01 months between defects.
Because it is difficult to think in terms of .01 months, you can specify a more intuitive MTTD time unit. If you select days, then .01 months is the same as .01 * 30 (roughly) or .3 days between defects (assuming you are running 7 days a week). However, if you are running only 5 days a week, then .01 months converts to (.01 * 20) or .2 days.
I sometimes get poor defect curve fits when running a forecast. What can I do to improve this?
Getting a good curve fit is important - the poorer the fit, the less confidence you will have in the projected new time for that set of data. The goodness of fit is particularly important during the latter stages of Phase 3 because defect data is weighted more heavily at that time. There are two things you can do to improve your defect curve fits:
1. Assess the reliability of early data points carefully. If you have little confidence in the earliest defect data, you should throw it out. Our theoretical defect data curve algorithm assumes defects are being captured from the start of Phase 3 in a consistent and systematic manner. In practice, however, systematic logging of defects is often not performed until around Systems Integration Test (71% of phase 3 duration). If your early defect data is very erratic, chances are those data points are unreliable. If you know (or suspect) this to be the case, exclude the unreliable data points from curve fitting and forecasting. Unreliable data introduces random noise into SLIM-Control's calculations and creates unreliable forecasts.
2. Try to determine the best tuning factor for your defect data. This is fairly easy to do once any early noisy data points have been discarded. There are two ways to get a handle on the defect tuning factor. You can use either one, or combine the two methods:
- The first method uses past projects to generate a historic defect tuning factor. You can use any similar projects captured in SLIM-DataManager. Individual defect tuning factors for each project can be displayed on DataManager’s Project List View by selecting Tools | Customize View Layout from the menu. To get the average Defect Tuning Factor for one or more completed projects, import them into SLIM-Control using the History | Load Projects menu item and then run the Defect Tuning Calculator. If you plan on using an average DTF from your history, you may wish to inspect the data and eliminate outliers to prevent distortion of the average.
- Once you have entered at least three actual total defect data points into SLIM-Control the Defect Tuning Calculator can also calculate a defect tuning factor from your actual defect data.
Once the expected defect total has been tuned to your history or actual data, you should see an improvement in your defect curve fits. If you’re tracking Defects Found by Category, here's one final step that will help ensure optimal curve fits:
- Tune the % of total defects for each category using your actual data. For more information on how to do this, see the FAQ entitled, "How Do I Tune My Defect Category Percentages?".
If you are still getting poor data fits after performing the steps outlined above, either try to determine the reasons or simply exclude defect data from the forecast curve fit.
The Solution Panel says my peak staff value is 10.3, but the Average Staffing Rate charts and reports show a peak staff of 10.1. What is causing this inconsistency?
The theoretical Rayleigh curve used to derive the values on the Solution Panel is a smooth curve resulting in different staffing numbers at each point along the x-axis. In drawing the Average Staffing chart, this smooth theoretical curve is approximated by a series of discrete staffing rates (with one bar, or average staffing rate value, per month).
The graph and solution panel values won't always match exactly because the graphical peak staff is always taken mid-month for any internal month while the solution panel always shows the highest peak staff point on the staffing curve (regardless of when it occurs). Usually the theoretical curve does not peak exactly at mid-month, so the true peak shown on the solution panel will not match the one on the average staffing charts unless the theoretical peak happens to fall at mid-month.
On large projects where a longer schedule allows a natural smoothing of the staffing curve, the theoretical peak staff will usually be close to the average staff rate value. On shorter projects, you can expect to see larger discrepancies.
How does SLIM-Control handle missing actual data points?
The answer to this question depends on the context. You can display interpolated or missing data points on charts via the "display interpolated data" option in the chart properties. If possible, SLIM-Control will interpolate missing data points using the expected shape of the associated metric curve. Note that only interior data points can be interpolated - SLIM-Control needs a start and end point for interpolation.
It's important to realize that interpolated data points have no bearing on the analysis of actual data in SLIM-Control. When you run a forecast, missing data points are not used during curve fit analysis. The only time missing data is not completely ignored is in the case of milestones. If a milestone should have occurred prior to the projection date (and no actual milestone date has been entered), SLIM-Control assumes the milestone has been missed and the earliest it can occur is immediately after the date of projection. If more than one milestone is "missing", it is assumed that they have all been missed, and that the earliest missed milestone cannot occur before the date of projection.
When I change the Person Hours per Person Month field on the Accounting tab of the Solution Assumptions dialog, there is no change to the total schedule and effort for the project. Why is this?
Many SLIM-Estimate and SLIM-Control users have asked why their overall schedule does not change when they change the value of the "Person Hours per Person Month" field, Solution Assumptions screen, Accounting Tab.
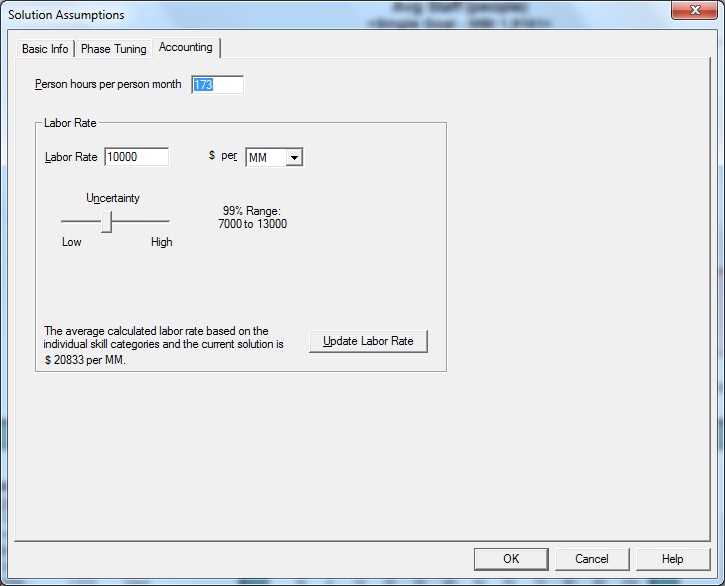
The number of Person Hours comprising a particular organization's Person Month is not used to calculate total effort. If your chosen effort unit is Person Months, the hours per month setting is not used at all. If, on the other hand, your effort unit is weeks, days, or hours, your hours per month will be used to convert the estimated total effort (in Person Months) into your chosen effort unit.
At first, this may seem counter-intuitive. Shouldn't an increase or decrease in the number of Person Hours in a Person Month be reflected in the final estimate?
The number of staff hours in an organization's staffing month is more relevant in the accounting world than it is in software estimation. It attempts to account for items such as vacations, meetings, and administrative activities but in most cases, it is merely an estimate or average. It may tell how many hours will be charged to a particular project, but has nothing to say about how much is actually accomplished during those hours (or even how many actual hours were worked). The productivity index, or PI, is where actual work produced is measured.
The Productivity Index, or PI, reflects a number of environmental factors such as:
application type / complexity team skill/experience management effectiveness | requirements stability availability / quality of tools development methodology. |
If you are using a PI calculated from your past projects, your user-specified PI already reflects the conditions in your working environment. Holding other factors constant, organizations which have high "administrative overhead" will tend to have a lower calculated productivity index than organizations which maximize time spent working on the most productive project tasks.
SLIM-Estimate® is a macro model based on the software equation described in Measures for Excellence. The SLIM software equation is designed to estimate consistently across a broad spectrum of working environments and accounting standards. For this reason, the effort parameter was originally calculated in Person Years, which are converted to Person Months in SLIM-Estimate. Once the total effort in PM has been determined, it can be converted into your chosen effort unit for display on charts and reports. But what if you have no historical data and are using the PI suggested by the QSM database? SLIM estimating and project control tools will still give you a good first estimate that you can continue to refine as more project data becomes available. As projects are completed, SLIM tools will calculate the project PI's from your historical data. These PI's can be used to calibrate new estimates to the unique conditions in your development environment.
As you begin to compare and analyze PI's from completed projects, you can spot and eliminate bottlenecks as well as identify successful strategies that you can repeat to improve productivity. Storing project metrics in a useful and accessible form and analyzing them to identify trends is the key to process and productivity improvement. Consistent use of SLIM tools results in increasingly accurate estimates and will help you build a repository of historical data for future analysis and benchmarking.
I’d like my MTTD forecasts to reflect the number of test hours for each reporting period. How do I do this in SLIM-Control?
The Weighted MTTD option allows you to account for the actual hours spent testing each reporting period. Often the number of test hours fluctuates from month to month, causing large swings or "find and fix cycles" as test effort is directed to finding defects one period, then drops off as effort goes into fixing newly discovered defects during the next period. Using the Weighted MTTD option will smooth out these "find and fix" cycles, giving you a smoother defect curve. Be sure to click the box at the top of the Metric Definitions dialog box in order to display both active and inactive metrics.
To use the Weighted MTTD metric, you must activate it by choosing Tools | Customize Metric Definitions from the menu. Locate the active defect metrics folder (Hint: the folder title will be bolded). If you don't see the metric, make sure you are displaying all active and inactive metrics. Scroll down and select the Weighted MTTD metric, then click the Edit Metric button:
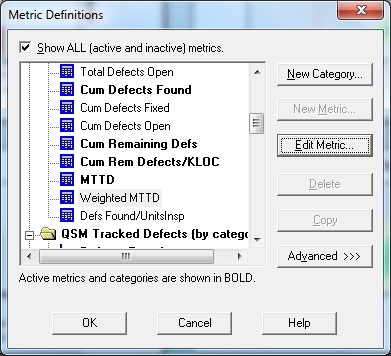
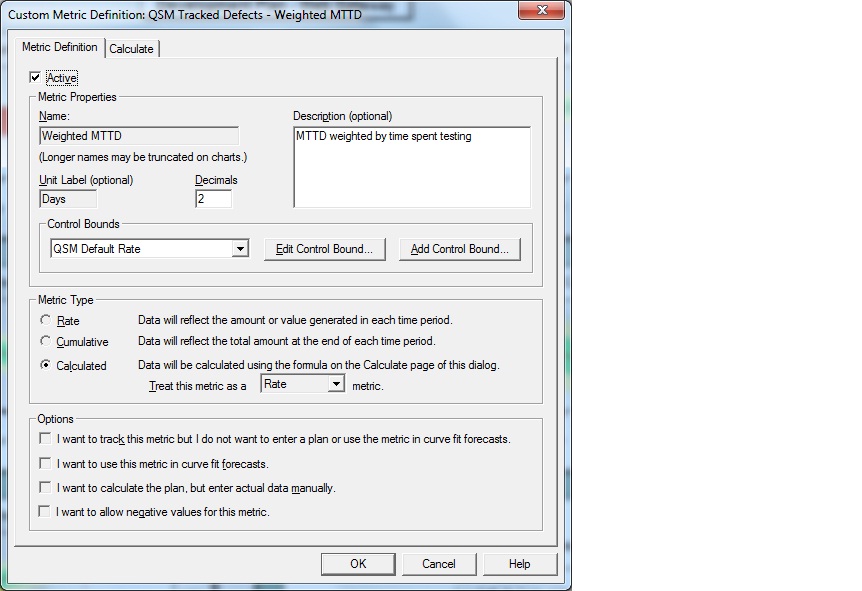
Activate the metric by checking the “Active” checkbox and click OK to exit.
Next, activate the QSM Test folder. Note the lack of bold type – this category is inactive by default. Select the folder title and activate the category using the Edit Category button:
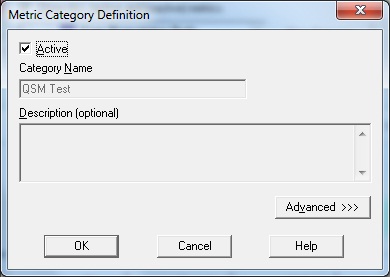
Click OK to save your changes and exit the Metrics Definitions dialogs.
The number of testing hours per reporting period should now appear on the Metrics tab of the Actual Data screen (select Control | Actual Data from the menu). As with all custom metrics, the testing hours field is appended to the list of standard metrics so you will need to scroll down to the bottom of the metric list to see the Test Hours field. This is where you will enter the actual hours spent testing for each reporting period.
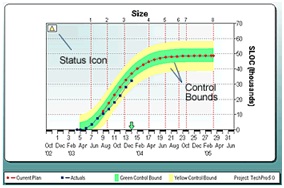
How are the control bounds in SLIM-Control® calculated? Can I change them?
SLIM-Control® ships with a set of pre-defined control bound shapes and widths to help you assess variation of the project actuals from the plan.
QSM control bound limits typically default to a percentage of the planned total or peak value for the metric being displayed, but you can copy and edit our default control bounds or create your own from scratch! In the custom control bound definition below, the green upper control bound is wider (14% of the planned peak value) than the lower green control bound (11% of the planned peak):
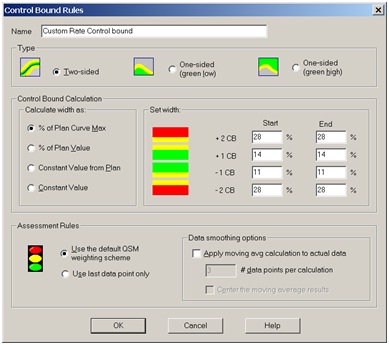
Wider control bounds allow more deviation from the plan before triggering a visual warning. Narrower control bounds provide earlier warning and tighter control. QSM default control bounds vary in width depending on whether the metric being assessed is in rate or cumulative form. Because defect data is typically more variable than other software metrics, control bounds for defect metrics default to twice the width of regular rate and cumulative control bounds.
Regardless of whether you use QSM default control limits or create your own control bound rules, SLIM-Control’s status icons help you instantly assess the status of various project metrics and take corrective action:
- When your actual data fall an average of one control bound from the plan, a green status icon lets you know the variation is within acceptable limits. When calculating the average distance from the plan, SLIM-Control® considers all data points but gives more weight to the later data points.
- When actual data average 1-2 control bounds from the plan, a yellow (warning) status icon is shown. The yellow icon alerts the user that the displayed metric needs to be monitored closely.
- When the data points average more than 2 control bounds from the plan, a red status icon will be displayed to indicate that re-planning may be needed. The user can generate a new forecast to completion to learn the impact of current deviations upon the delivery date.
The Scoreboard Summary Report can even create an audit trail for key project metrics over time:
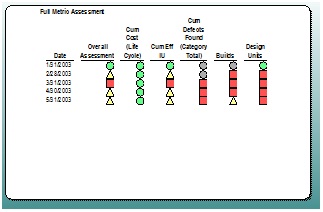
Need more information before making a decision? SLIM-Control’s Snapshot Manager records the status (green, yellow, or red) of various metrics as the project unfolds. This time series view adds context to your analysis: if a “red” metric has consistently lagged behind the plan, it’s probably time to take corrective action. If the same metric has stayed in the green region for the entire project, a red status icon could alert you to a possible data entry error.
SLIM-Control’s customizable control bounds, status icons, and snapshot manager make tracking and monitoring projects a snap!
