Scaled Agile (SAFe) is a methodology that applies Agile concepts to large complex environments. QSM recently worked with an organization that had implemented SAFe to develop an estimation methodology specifically tailored to it. This article discusses how it was implemented.
Software estimation typically addresses three concerns: staffing, cost/effort, and schedule. In the SAFe environment, however, development is done in program increments (PI) that in this case were three months in duration with two-week sprints throughout. Staffing was set at a predetermined level and varied very little during the PI. Thus, the three variable elements that are normally estimated (staff, cost/effort, and schedule) had already been determined in advance. So, our job was done, right? Wrong! What remained to be determined was capacity: the amount to be accomplished in a single PI. And that was a very sore “pain point” for the organization.
QSM set out to determine the most appropriate sizing unit to use for estimating PIs. We determined that Epics would not be useful as a sizing unit since one epic might span several PIs and it was PIs that we needed to estimate. However, epics could be decomposed into features and features are units of work that are completed in a single PI. During PI planning, work focused on determining which and how many features from the backlog would be assigned to the upcoming PI. Based on this reasoning, features appeared to be a good size unit to focus on to estimate capacity. Features, however, vary significantly in complexity and we would need to determine a method for assigning weights to features based on their complexity. It was at this point that user stories came into the picture. Each feature was further divided into the number of user stories that were required to implement the feature. The number of user stories varied widely, from 1 to 50 in our research, and was known at the time of PI Planning therefore making it useful for estimation.
After much discussion and modeling we assigned four complexity categories (small, medium, large, and extra-large) to features based on the number of user stories in that feature and further assigned a weight to each category. Determining these weights made up the largest percentage of our effort. Fortunately, we had data from several completed program increments which included the number of user stories for each feature. Using this data we modeled each completed PI varying the relative weights of each complexity category until we arrived at a model that was consistent with the historical data.
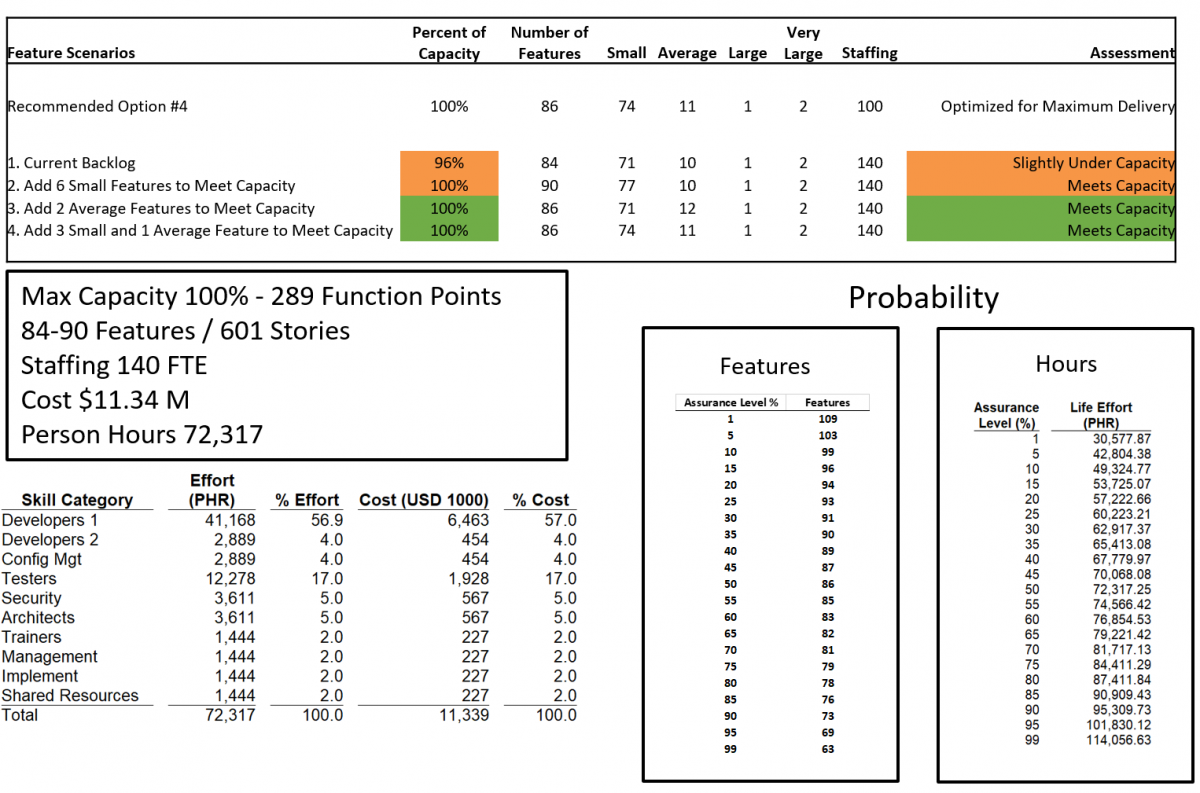
To implement our findings we built Program Increment capacity planning tool. During PI planning, users enter the number of features from each complexity category that they wish to complete in the PI. The capacity planning tool then calculates the proposed plan’s consistency with its organizational history (at, under, or over capacity). This greatly simplifies “what-if” analysis and provides an empirical basis for determining which features to include in a PI where none existed before.
Here is an example of the input side of the capacity tool. Note that the user can modify the input variables to match the environment and change the number of features and mix of features to perform “what-if” analysis.

The output of the tool compares the desired solution to historical performance and makes a recommendation based on proven capacity.

If you are experiencing problems matching capacity with demand in your Scaled Agile release train planning and would like to develop an empirically-based methodology that reduces the uncertainty and risk, take advantage of the work QSM has done. We can help you tailor a solution that meets your needs.
