David McCandless gave a TED talk in July 2010 that focused on pairing data and design to help visualize patterns. In his talk, McCandless takes subsets of data (Facebook status updates, spending, global media panic, etc.) and creates diagrams which expose interesting patterns and trends that you wouldn't think would exist. Although the focus of McCandless' talk was about how to effectively use design to present complex information in a simple way, I was struck by his own claim that data is not the new oil, but rather that data is the new soil. For QSM, this is certainly true!
QSM maintains a database of over 10,000 projects with which we are able to grow a jungle of ideas, from trend lines to queries about which programming languages result in the highest PIs. With the amount of soil that we have, we are able to provide insight into the world of software, just with the data that is graciously provided by our clients. By collecting your own historical data in SLIM-DataManager, you can create your own trend lines in SLIM-Metrics to use in SLIM-Estimate and SLIM-Control, analyze your own data in SLIM-Metrics, tune your defect category percentages and calculate your own PI based on experience in SLIM-Estimate, and much, much more.
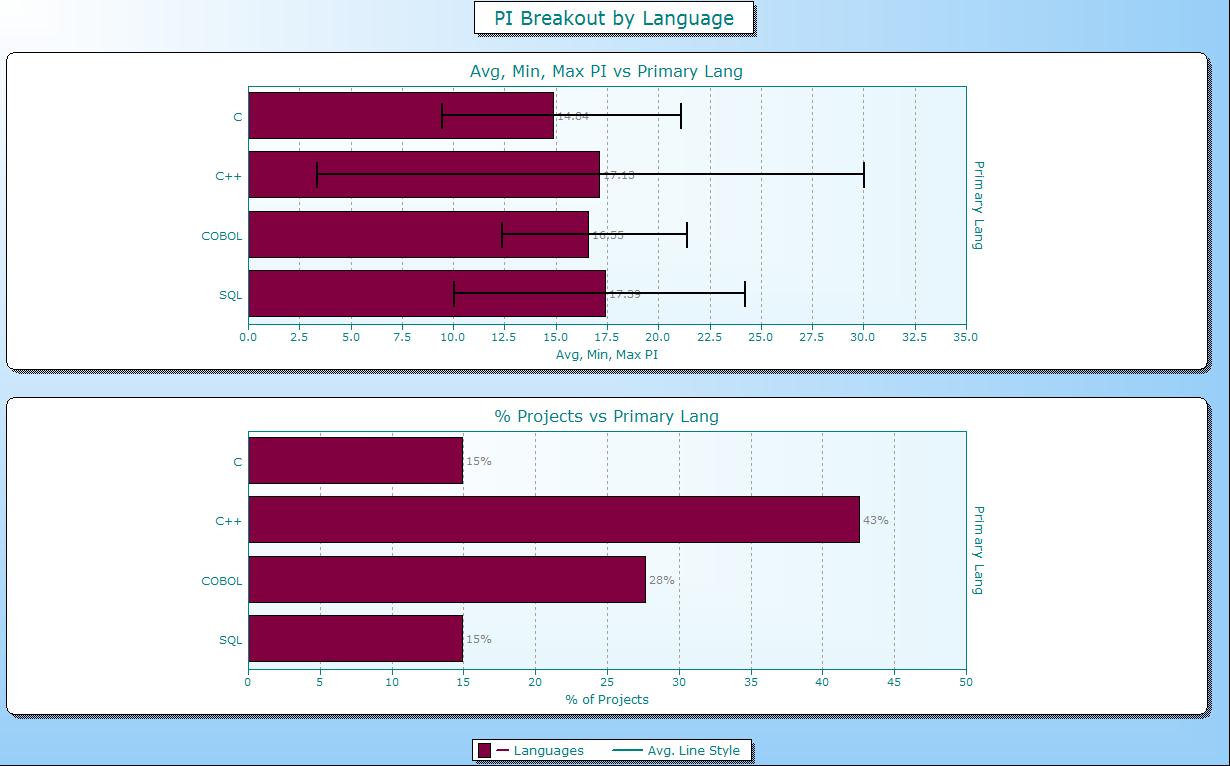
Kate Armel came up with this great SLIM-Metrics workbook to help us automate the database validation effort. Much like McCandless’ data visualizations, the goal of the workbook is to give us a bird’s eye view of the databases that we have received so far to help us get an idea of what kinds of projects are in the database, how complete the SLIM-DataManager file is, and what the best way to sort the projects would be in order to make the validation process more streamlined.
Here’s a sneak peek:

How are you making the most of your data? What can you grow with your data?
