SLIM-DataManager

SLIM-DataManager

Base Size Unit vs. Function Unit


What is the difference between the Base Size Unit and the Function Unit?

The Function Unit is a measure of software size, which represents the project scope or the amount of work to be done.  It makes sense to dscribe a book as a collection of chapters, or a building by the number of floors or rooms it contains.  The Function Unit allows us to describe a system as a group of functional or logical components, e.g., Function Points, features, reports, or interfaces.

Taxonomy upgrade extras 
SLIM-Estimate SLIM-DataManager

QSM Releases SLIM-Suite 10.3

We are pleased to anounce the release of SLIM-Suite 10.3, the latest version of our flagship software management tool suite. The pandemic has put enormous pressure on business leaders to utilize resources wisely while juggling development teams in remote locations. With that in mind, our goal with the newest release was to provide several small, yet powerful improvements designed to save time and increase consistency at every step of the project and portfolio planning process.

Improvements to SLIM-Estimate's Skills Breakout configuration make it easier to fine-tune skill categories and labor rates to support better resource demand planning at both the project and portfolio levels.  Additionally, the tool's API now exposes the Sizing and PI (Productivity Index, QSM's proprietary productivity measure) calculators for users who wish to leverage these features directly from a spreadsheet or other external applications.

SLIM-DataManager, QSM's database repository tool, has new functionality designed to make it easier to validate, understand, and analyze your portfolio of projects. Power editing and enhanced keyword management allow quick changes to multiple projects right from the master project list. Power editing makes it easy to add/update descriptive “tags” used to group projects into relevant categories for benchmarking and estimate calibration.

In addition to the new configuration capabilities, SLIM-Suite 10.3 features new agile enhancements, such as an updated SLIM-Estimate agile template. SLIM-Estimate and SLIM-Control now allow users to instantly toggle the display of agile increment lines between sprints, program increments, or both levels of detail.

Data-Less Decision Making

I rather enjoyed the Google Analytics April Fools prank earlier this month, Welcome to Data-Less Decision Making on Analytics Academy.  Though satirical, this video brings to light an important reason why individuals have such trouble making decisions in a business environment: they don’t have data.

I’ll agree that without data it’s really appealing to turn to the coin flip method and be done with it.  After all, 50/50 odds really aren’t terrible, right?  But project management software such as SLIM-Estimate make empirically-based business decisions possible, even when company data isn’t immediately available.

Leveraging our database that contains over 10,000 projects, QSM has developed and regularly updates 17 distinct industry trends.  When creating an estimate or benchmarking a past performance, simply select the QSM industry trend that most closely reflects the type of system being built.  This will serve as a reference point.

If historical data is available but you’re unsure of which metrics to collect, SLIM-SmartSheets is a new downloadable feature in SLIM version 8.2 that mimics the look and feel of SLIM-DataManager and allows users to collect project data, even when they’re not on a network computer.  Each project can then be pulled into one SLIM-DataManager file using the API.  

SLIM-SmartSheets

How to Use Big Data to Improve Your Software Projects

In the recent Washington Post article How the Obama Campaign Won the Race for Voter Data, Joel Kowsky writes about how the 2012 Obama campaign used analytics to improve their campaign strategy, and to ultimately secure the presidential victory.  

Regardless of where you stand on the political spectrum, it’s hard to argue that Barack Obama’s campaign strategy was anything short of impressive.  As soon as Obama took office in 2009, his team began preparing for his 2012 campaign.  From the start there was a strong emphasis on measuring the campaign’s progress.  Jim Messina, Obama’s 2012 campaign manager, stated 

“There’s always been two campaigns since the Internet was invented, the campaign online and the campaign on the doors.  What I wanted was, I didn’t care where you organized, what time you organized, how you organized, as long as I could track it, I can measure it, and I can encourage you to do more of it.”

The team began by conducting a postmortem study on their 2008 campaign where they analyzed the number of homes visited, phone calls placed, and voters registered by each field organizer and volunteer.  The result was a 500 page report which highlighted areas of improvement for the 2012 campaign.  

The suggestions led the Obama campaign to invest in building customized software that would integrate all the data the campaign had collected on voters, donors, and volunteers and link to individual voter profile.  This software analyzed previously collected data to calculate the likelihood of candidate support, the likelihood of election day turnout, and the degree of persuasion for each voter.  

Database Validation Best Practices

Database validation is an important step in ensuring that you have quality data in your historical database.  I've talked before about the importance of collecting project data and what you can do with your own data, but it all hinges on having thoroughly vetted project history.

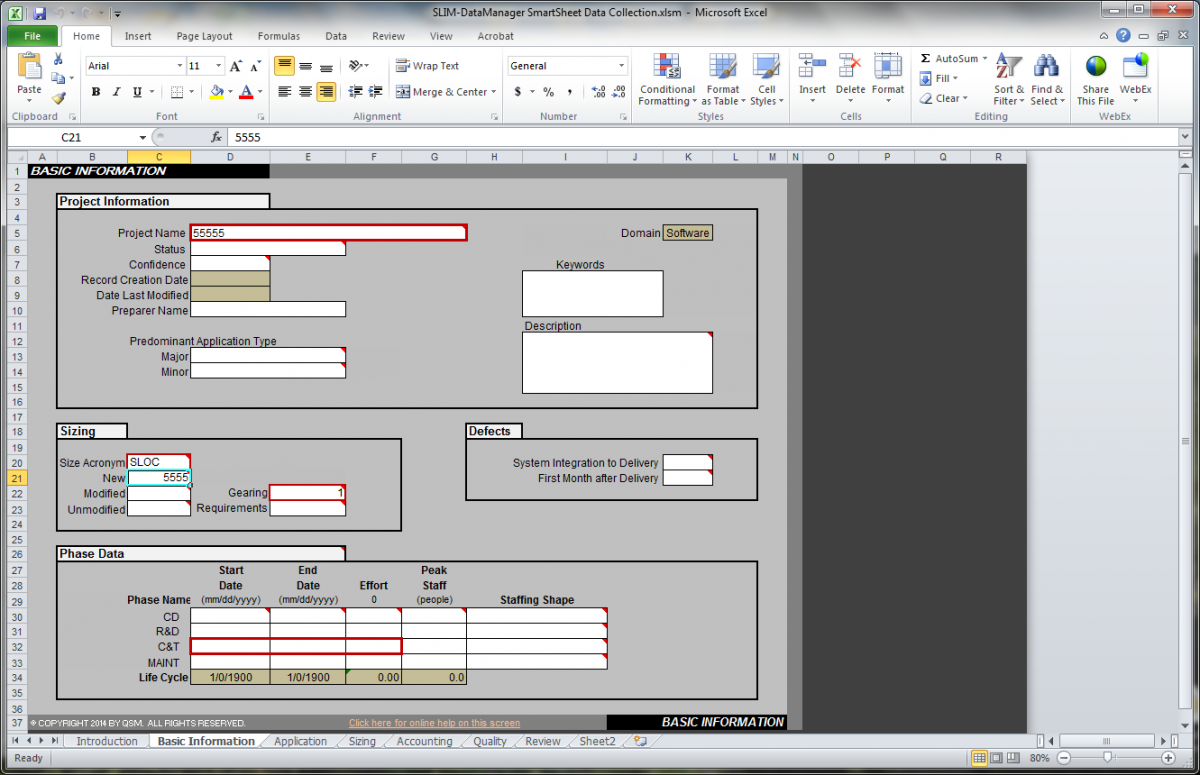
Although it's nice to have every tab in SLIM-DataManager filled out, we really only need three key pieces of information to calculate PI:

  • Size (Function Unit): if the function unit is not SLOC, a gearing factor should be provided (97.3% of projects in the database report total size)
  • Phase 3 duration or start and end dates (99.9% of projects in the database report phase 3 duration)
  • Phase 3 effort (99.9% of projects in the database report phase 3 effort)

These fields can be thought of as the desired minimum information needed, but even if one is missing, you may not want to delete the project from the database. A project that is missing effort data, for instance, will not have a PI but could be used to query a subset of projects for average duration by size. Likewise, a project with no size will not have a PI, but does contain effort and duration information that could be useful for calculating the average time to market for a division. However, if possible, it is a good idea to fill out at least these three fields.

Blog Post Categories 
SLIM-Metrics Data SLIM-DataManager Database

Data Myths

In a post for The Guardian's Datablog, Jonathan Grey explores the rise of data journalism. Data journalism is "a journalistic process based on analyzing and filtering large data sets for the purpose of creating a new story. Data-driven journalism deals with open data that is freely available online and analyzed with open source tools. 

Although data is a powerful tool, Grey reminds readers that it's not a silver bullet and counters some commonly held data myths. 

Data is not a perfect reflection of the world.

Blog Post Categories 
SLIM-Metrics Data SLIM-DataManager

Agile Series Part 2: Stakeholder Satisfaction

When learning something new, people often try to relate the new information back to something they already know in order to help make sense of the new concept or idea.  As a psychology major now working in the software world, I’ve found myself relating a lot of what I’m learning back to the psychological theories and concepts I learned in college.  Therefore, it is no surprise that upon reading The Twelve Principles of Agile Software, I’ve discovered that many of their principles map to organizational psych concepts.

Agile development theory approaches software development holistically.  I believe this is one of the reasons Agile projects have become so successful.  Rather than merely focusing on skill development, Agile methods foster leadership skills and teamwork among members of the development team itself, as well as between the development team, the project owner, and the stakeholders.  One avenue for this is to unify the development team and project owner with the common goal of achieving stakeholder satisfaction.

The first principle states, “Our highest priority is to satisfy the customer through early and continuous delivery of valuable software.”  The question I had upon reading this was what do the authors mean by the term satisfaction?  When thinking about satisfaction, most people think of outcome satisfaction, or the ultimate outcome of something, in this case the functionality of the delivered software project.  Process satisfaction on the other hand, refers to the level of satisfaction associated with the method of developing the software, or how much the stakeholders enjoy the software development process.

What's Left Behind When Your Project Is Over

The 2012 Olympics are over and it will be another four years until we can all discuss how much we hate NBC's coverage.   Susy Jackson of the Harvard Business Review blog points out in her blog post  that while the games of years past have been huge spectacles  of debt, the London Olympics have attempted to be "green," in that many of the structures built for the 2012 games will be reused for the 2016 Rio games and other events.  Instead of building permanent structures that will be abandoned shortly after the games are over (HBR mentions the " temporary arenas still standing in tatters in Beijing, frogs inhabiting an abandoned training pool in Athens, a forgotten ski jump resting quietly in Italy"), the London Legacy Development Corporation attempted to reuse about one-third of all structures created for the games. 

Naturally, this inspired me to find the link between the Olympics and software development.  

One commenter Uri writes:

I think there is much more than buildings that are left behind. There is huge pull of amazing skills, knowledge, technological advancements which if planned and used properly can prove to be a bigger and much more sustainable contribution. However, putting these into use may require more thinking and planning then the reuse of infrastructure.

Blog Post Categories 
SLIM-DataManager

Taking Responsibility for Quality Data

Thomas C. Redman recently wrote about data quality on the Harvard Business Review blog.  In his post, he creates a vignette of an executive who finds an error in data provided by the "Widgets Department" for an important meeting. The executive corrects the error, the meeting is a huge success, and the story ends there. Redman argues that someone should have gone back to the Widgets Department to report the error, not to complain that the error could have ruined the presentation, but rather that it could ruin the next person's presentation.

The hardest part about database validation is not reviewing every individual project, but rather, determining if the information on each tab is correct. Sometimes, it's easy to tell that the organization name is spelled incorrectly, other times, it's difficult to discern if a labor rate is incorrect. Having a well-documented database is important, not just for your own use, but for whatever you plan on using it for next.  For example, if you plan on making custom trend lines, but you recorded that it took you 31 man months instead of 3.1 man months, that would have a disastrous effect on your trends! It's obvious that the error would need to be recorded, but it's also important to report the error to whoever prepared the data so that they can check the rest of the projects in the database for the same error. 

Redman suggests creating an office culture which promotes the following three points:

Blog Post Categories 
Data SLIM-DataManager

Data is the New Soil

David McCandless gave a TED talk  in July 2010 that focused on pairing data and design to help visualize patterns.  In his talk, McCandless takes subsets of data (Facebook status updates, spending, global media panic, etc.) and creates diagrams which expose interesting patterns and trends that you wouldn't think would exist.  Although the focus of McCandless' talk was about how to effectively use design to present complex information in a simple way, I was struck by his own claim that data is not the new oil, but rather that data is the new soil.  For QSM, this is certainly true!

QSM maintains a database of over 10,000 projects with which we are able to grow a jungle of ideas, from trend lines to queries about which programming languages result in the highest PIs.  With  the amount of soil that we have, we are able to provide insight into the world of software, just with the data that is graciously provided by our clients.  By collecting your own historical data in SLIM-DataManager, you can create your own trend lines in SLIM-Metrics to use in SLIM-Estimate and SLIM-Control, analyze your own data in SLIM-Metrics, tune your defect category percentages and calculate your own PI based on experience in SLIM-Estimate, and much, much more.