Database validation is an important step in ensuring that you have quality data in your historical database. I've talked before about the importance of collecting project data and what you can do with your own data, but it all hinges on having thoroughly vetted project history.
Although it's nice to have every tab in SLIM-DataManager filled out, we really only need three key pieces of information to calculate PI:
- Size (Function Unit): if the function unit is not SLOC, a gearing factor should be provided (97.3% of projects in the database report total size)
- Phase 3 duration or start and end dates (99.9% of projects in the database report phase 3 duration)
- Phase 3 effort (99.9% of projects in the database report phase 3 effort)
These fields can be thought of as the desired minimum information needed, but even if one is missing, you may not want to delete the project from the database. A project that is missing effort data, for instance, will not have a PI but could be used to query a subset of projects for average duration by size. Likewise, a project with no size will not have a PI, but does contain effort and duration information that could be useful for calculating the average time to market for a division. However, if possible, it is a good idea to fill out at least these three fields.
The main question to ask yourself in the validation process is: does anything jump out? We're looking for potential data entry errors or perhaps just a-typical projects. A good starting point is to use the Validation feature in SLIM-DataManager. Simply go to File|Maintenance|Validate, and SLIM-DataManager will check for the following project details:
- Out of sequence phases (requirements phase starts after code and test, etc.)
- Invalid or incompatible size records (gearing factors for subsidiary size records don't jibe with reported size, effective size is null)
- Metrics where the percentages don't add up to 100% and they should (defect % of total, application type percentages, etc.)
- Metrics where the percentages add up to more than 100%
- Application type doesn't match application percentages
- Missing or inconsistent percentage values in the size and language records on the sizing tab
- Duration inconsistent with phase start/end dates
- Custom metric values are out of range (ex., a metric accepts values from 1 to 10)

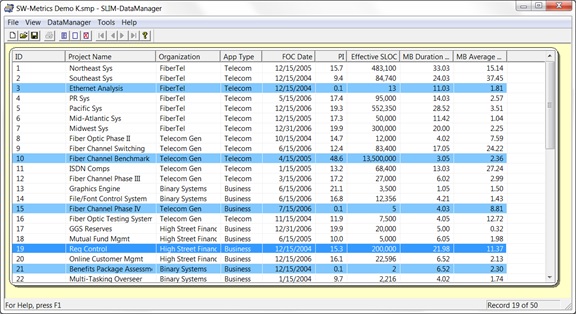
If you have out of sequence phases or other inconsistences, SLIM-DataManager will highlight those projects in blue. If you hover over them, a tool tip will appear which will tell you what you need to check out.

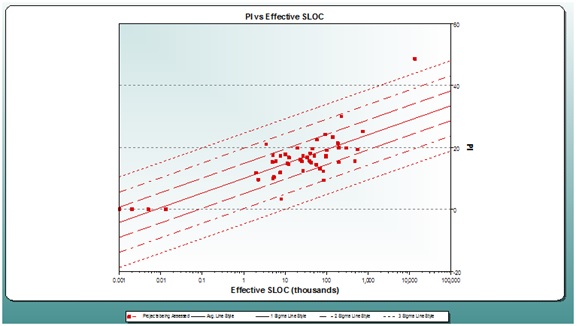
Another method of identifying extreme data values is to sort the columns for PI, peak staff, or other metrics in the Project List view in SLIM-DataManager or to examine the data in a scatter plot in SLIM-Metrics. If you suspect a value is an outlier, display it against trends for both the data set and the comparable QSM application domain. If it is outside of three standard deviations from the mean, it is an outlier and should probably be excluded from the trend, though you may want to retain the project. In the image above, notice the project sitting outside of three standard deviations at roughly 10,000K SLOC. This project is a-typical for the PI vs. SLOC trend, but for other trends, it might be typical. Instead of deleting the project from your database, you can remove the project from the curve fit by right-clicking on the project and selecting Special Project, then go to Metrics|Exclude Special Projects from Curve Fit, then recreate your trends.
If your data is going into a corporate database, it would be a good idea to use keywords and other descriptive data for querying and sorting. Often times, the data collector won't fill in that information because he or she knows what the project is about, but in a corporate setting, that information can be priceless. For example, if your organization uses Agile and waterfall methodologies, it might be helpful to tag those projects using keywords to help easily identify them.
In my experience validating data for QSM's historical database, here are a few extra tips:
- If you have completed project data from multiple countries, check to make sure the monetary units and conversion rates are accurate.
- If you have requirements documented on the Basic Info tab, be sure to make a separate sizing entry on the Sizing tab so that a gearing factor is calculated. You can then use that gearing factor for future projects which use requirements.
- Make sure your labor rates and labor rate units make sense ($100 labor rate per person hours instead of $100 labor rate per person year).
- If you have a large database, you can create a validation workbook in SLIM-Metrics and model the tabs in SLIM-DataManager to make this task more manageable. To check the labor rates, for example, create a view that has a yearly labor rate bar chart which will show you if you have any projects with unusually high or low labor rates, as well as a labor rate vs. effective SLOC scatter plot converted to a report to help you identify those projects with unusual labor rates.
- Use the Description field to make notes or observations. If you change an obviously wrong value, make a note in the Description field with your name.
These are just a few ways you can verify the quality of the data in your database. The database validation process does take considerable time, but in the end, it's worth knowing that the data you use for trend lines, benchmarking, and to tune estimates is as accurate as possible.
