How is baseball analysis like software project management? One way is the ability to continually update estimates and forecasts, as the situation and our knowledge change. As Larry Putnam Jr recently wrote, “project estimation should continue throughout the entire project lifecycle”.
Walter Shewhart, the father of Statistical Process Control, explained it like this:
“…since we can make operationally verifiable predictions only in terms of future observations, it follows that with the acquisition of new data, not only may the magnitudes involved in any prediction change, but also our grounds for belief in it.”
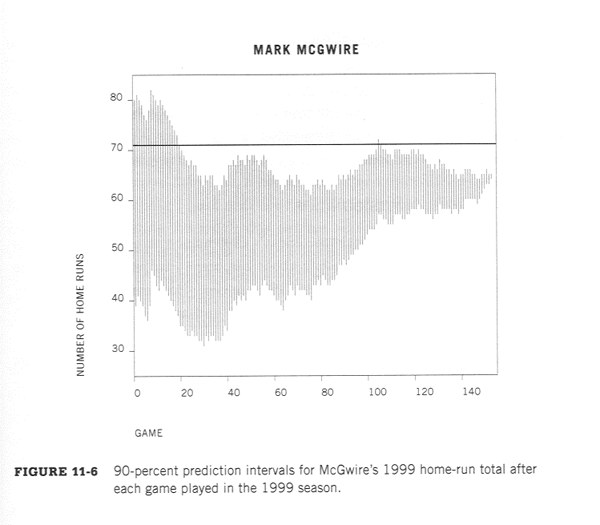
Here is a baseball example that should appear very familiar to software estimators who are familiar with the often quoted cone of uncertainty. The following graph is taken from Curve Ball: Baseball, Statistics, and the Role of Chance in the Game, by Jim Albert and Jay Bennett.

The above model is based upon only a few simple items: The number of homeruns hit so far; the number of games played so far and number remaining; and the total number of games in a season. We could try to improve the model, especially early in the season, by incorporating more information. For example:
- Probability of injury. McGwire missed most of 1993 and 1994 due to injury.
- Past performance. In 1998 McGwire hit 70 homeruns. In 1997 he hit 58, split between two teams.
- Impact of home park. In 1998 McGwire played half his games (the home games) in the same park as in 1999.
- Age. In October of 1998 McGwire became 35 years old. Player performance tends to increase to a point, and then, inevitably, decrease with age.
- Risk of other factors (such as player suspension!).
Compare this graph to our similar situation in the estimation of software development effort.
We have relatively large uncertainty early in the life cycle compared to later when more is known. For agile projects, we have large uncertainty in the first few sprints, less for the later sprints. Not only do estimates shift up or down, but also the prediction interval shrinks.
And, as with the baseball example, we can improve our software estimates by incorporating more information, such as:
- Historical development performance by this organization, or, even better, for previous releases of this application
- Productivity versus size for similar application types
- Defect and testing metrics
- Staffing plans
- Reuse
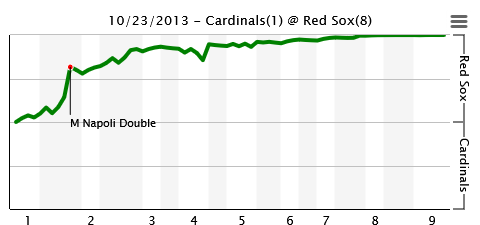
Another source of baseball examples is a website called Fangraphs. Fangraphs publishes advanced baseball statistics. One item they produce is a graph for each major league game showing the win probabilities after each play (after an out, or after a change in the baserunners). Some graphs show a one sided contest, for example this graph from game 1 of the 2013 World Series. In the middle of the game, with a 5-0 lead, the Red Sox had about a 95% chance of winning. This probability is based on the historical distribution of runs scored as well as the game score, the inning, and the historical value of baserunners and outs.

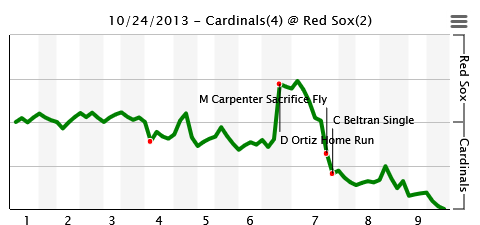
Happily, not every game is one sided. In other games, the lead changes hands. For example, in Game 2 (the very next game) the Cardinals scored first. But the Sox came back to a 2-1 lead and had about a 75% chance of winning at that point, before the Cardinals regained the lead and went on to win. This can be quickly seen in the following line graph.

In baseball, the lead can change hands. In software projects, the probability of meeting a milestone on time can change. What Shewhart knew to be true in the 1920’s is true today for both baseball and project management: estimates need to change to reflect changing knowledge.
Sources:
Estimate Before, During and After the Software Project, Larry Putnam Jr., 2014.
Curve Ball: Baseball, Statistics, and the Role of Chance in the Game, Jim Albert and Jay Bennett, 2001.
Statistical Method from the Viewpoint of Quality Control, Walter A. Shewhart. Dover, 1986 edition.
