Benchmarking

Benchmarking

3 Ways Historical Data Improves Software Development Negotiations

Two people reviewing software project performance data to support software vendor negotiations

How many times have you been involved with a software project or a portfolio of projects where the schedule or budget is doomed from the start? It happens all the time. One of the best ways to avoid this problem is to leverage historical data – actual performance of completed software projects. QSM has over 46 years experience in software estimation and control. We have seen thousands of projects and products delivered, both in-house and vendor driven. One of the biggest problems we help our clients solve is negotiating the right cost and schedule targets. Whether advising a client on an in-house project, a vendor on their proposal, or an end user with a bid evaluation decision, one thing becomes very clear − all sides are trying to negotiate a cost and timeline that they feel comfortable with. The problem is that they often negotiate with little to no data of past performance.

Negotiating Initial Schedule and Budget Commitments

You don't need data from hundreds of projects, and it doesn’t need to be granular. Software project or release level data is a great place to start. It establishes a baseline that you can count on because the delivery targets have been achieved in the past. It is tough to argue with cost and schedule numbers that have already been proven, and of course, having the data at your fingertips gives you a leg to stand on when negotiating.

The best practice we recommend is to capture a few core metrics:

Pentagon Acquisition Needs Consistent Data-Driven Approach for Accountability

DoD acquisition

This post was originally published on Linkedin. Join the QSM Linkedin Group and Company Page to stay up-to-date with more content like this.

When the Honorable Ellen M. Lord, Undersecretary of Defense for Acquisition & Sustainment (USD/A&S) told the Senate Armed Services Committee on Dec. 7 that she intends to demand a higher level of accountability from program managers, you could feel mixed emotions from DoD acquisition professionals. Many are applauding the vocal prioritization on accountability. However, I’m sure struggling acquisition program managers and support contractors, are likely feeling they have a more focused target on their back. There will certainly be other major changes from the former Acquisition, Technology and Logistics (AT&L) office reorganization to two new USD-level offices of USD/A&S and Research & Engineering (USD/R&E). Each will surely be eager to show respective value to the Pentagon in their responsibilities to improve the DoD acquisition process. Particularly, as the DoD continues a focus on DoD business transformation priorities and ensuring that they are acquiring effective defense business systems with capabilities to support those priorities, I’d like to offer some firsthand observations that suggests there still remains a lack of consistency in how we manage that process.

Accountability Requires Consistency

Blog Post Categories 
Government Estimation Benchmarking

New Article: Using Software Project Metrics

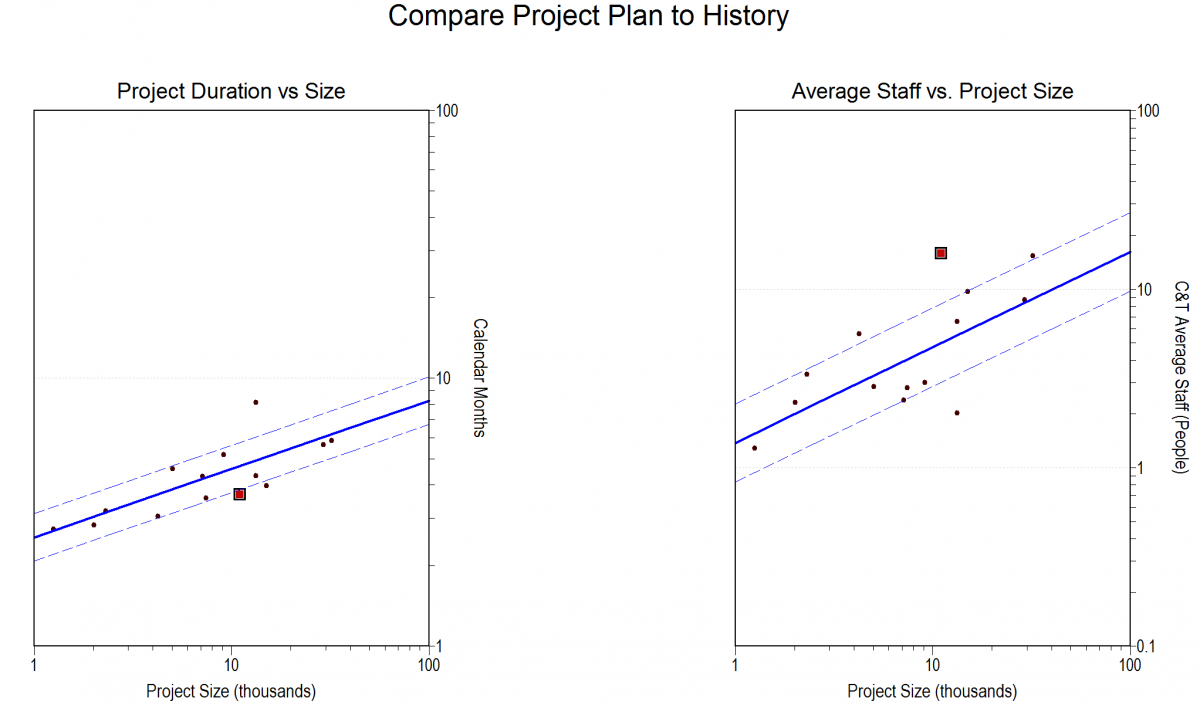
Compare Project Plan to History

Software measurement by itself does not resolve budget, schedule or staffing issues for projects or portfolios, but it does provide a basis upon which informed decisions can be made. Here are examples of how to use metrics to determine present capabilities, assess whether plans are feasible, and explore trade-offs if they are not. This is the third article of a three part series by QSM's Don Beckett for Projects at Work. You can read the first article here and the second here.

Read the article!

A Software Metrics Snow Job

I like to ski.  I mean really like to ski.  I've done it for a long time and I fancy I'm quite good at it.  I Iike to have the latest gear too.  So I have this Ski Tracks app on my iPhone see.  It's very cool.  When I start skiing for the day I set it going and it records every run I make: the altitude, the speed.  Heck, it even tracks your runs on a map that you can export and relive on Google Earth.  Really. 

Ski Tracks also summarizes your days' efforts showing the total number of runs, the total vertical skied, the maximum altitude, the time spent skiing, the distance traveled, the angle of the slope…

A Hard Day on the Slopes

Software Metrics Snow JobSitting in the condo at the end of a hard day on the slopes of Breckenridge Resort in Colorado, I checked my Ski Tracks for the day.  "Woohoo!" I said.  "Glenn, come check this out!"  My ski buddy Glenn ambled in from the kitchen; we've skied together for several years, ever since our respective spouses decided that for some reason they didn't want to ski with us anymore. 

"Look at this," I exclaimed holding up my iPhone showing the summary of my day's skiing.  "Just check out this top speed!!"

Glenn squinted at the screen.  "Hmmm, 54.8 mph," he observed.

"How about that?" I asked rhetorically, "have the ol' legs still got it or what?"  I was inordinately pleased with myself.  I mean, 54.8 mph is FAST.

Blog Post Categories 
Metrics Benchmarking

What Software Project Benchmarking and Estimating Can Learn from Dr. Seuss

Software Estimation and Dr. SeussSoftware project benchmarking and estimating leverages the power of historical project data to do solid project estimates, yet the concepts behind such processes are often not well understood.  Benchmarking and estimating rely on productivity comparisons with completed (actual) projects in a historical database and on parametric equations that mimic real life.  I find that technical concepts such as software estimation or benchmarking often can be explained by using analogies that work in other industries.  As I was thinking about benchmarking and estimating this week, the popular children’s book, Dr. Seuss's Green Eggs and Ham, came to mind.

I was talking about data mining, benchmarking, and the SLIM Suite of software estimating tools with QSM’s research director, Kate Armel. It seems that many project estimators believe that creating microscopic slices of project data is the key to precision in estimating and benchmarking, when, in reality, bigger chunks of data take less time to assemble and provide greater value.  Projects are never exact duplicates of each other, however, there are valuable trends and patterns that come out of a few common characteristics.

Blog Post Categories 
Benchmarking Estimation

When You Plan Your Projects Impacts the Bottom Line

In my previous blog post, I discussed the similarities between software and home improvement projects, and how the planning process greatly impacts the project lifecycle.  Better planning in and of itself is a great way to streamline the Construct & Test Phase of development.  However, when you plan is equally important to the development process.

While watching home improvement shows, like Discovery Home’s "Flip That House," one of the primary concerns of the project manager is often how quickly the team can get started so that they can meet their target deadline.  One cringe-worthy line that I distinctly remember was “as long as we have activity, we have productivity.”  Unfortunately, activity and productivity do not necessarily go hand in hand.  

For instance, in software development a project manager may tell a developer at the beginning of a project to start building a system.  If the requirements have not yet been determined, it’s challenging for the developer to build anything.  Yes, it’s possible for the developer to start building something while the project manager decides what should actually be built.  However, once the requirements are finalized it’s very likely that the developer will have to go back and rework the code so that the system will have the desired functionality.  

Blog Post Categories 
Benchmarking Process Improvement

Updated Performance Benchmark Table

The latest version of QSM’s Performance Benchmark Table is live!

QSM is excited to announce the release of their latest version of the Performance Benchmark Table.  Last updated in 2009, the table provides a high-level reference for benchmarking and estimating IT, Engineering, and Real Time Systems.  It displays industry average duration, effort, staff, and SLOC (or FP) per Person Month for the full range of project sizes encompassed by each trend group. 

The results were analyzed from a database of 1,115 high or moderate confidence projects completed between 2008 and 2012.  Sixteen countries and 52 different languages were represented in this sample.  In addition to the industry average, minimum and maximum values were also provided for each metric to help give a range of possible results.

The project sizes differed somewhat from the previous version to accommodate the new range of sizes present in the data.  Rather than using the same project sizes across trend groups, we selected project sizes specific to each trend.  Since Business projects are typically smaller than Engineering or Real Time projects, this allows readers to select a size relevant to the type of project they’re estimating or benchmarking.  

This tool can be particularly useful to developers and/ or project managers who are new to estimation or do not have historical project data.  

Blog Post Categories 
Benchmarking Estimation

Webinar Replay: Using Benchmarking to Quantify the Benefits of Process Improvement

If you were unable to attend our recent webinar, Using Benchmarking to Quantify the Benefits of Process Improvement, a replay is now available.

With increasing pressure to improve quality while cutting costs, process improvement is a top priority for many organizations right now; but once we've implemented a process improvement initiative, how do we accurately measure the benefits? Benchmarking is critical to determining the success of any serious process improvement program. As with any type of measurement program, it requires an initial reference point to measure progress. To set our point of comparison, we first need to perform a benchmark on a contemporary sample of projects that are representative of the typical work that we do. In this webinar, industry expert Larry Putnam, Jr. will take you through the necessary steps to perform a successful benchmark - from collecting quantitative and qualitative data to establish the initial baseline benchmark all the way through to performing follow up benchmarks on new projects and process improvement analysis.

Larry Putnam, Jr. has 25 years of experience using the Putnam-SLIM Methodology. He has participated in hundreds of estimation and oversight service engagements, and is responsible for product management of the SLIM Suite of software measurement tools and customer care programs.

Watch the webinar replay!

Blog Post Categories 
Webinars Benchmarking Process Improvement

Webinar - Using Benchmarking to Quantify the Benefits of Process Improvement

On Thursday, Feb. 7, at 1:00 PM EST, Larry Putnam, Jr. will present Using Benchmarking to Quantify the Benefits of Process Improvement.

With increasing pressure to improve quality while cutting costs, process improvement is a top priority for many organizations right now; but once we've implemented a process improvement initiative, how do we accurately measure the benefits? Benchmarking is critical to determining the success of any serious process improvement program. As with any type of measurement program, it requires an initial reference point to measure progress. To set our point of comparison, we first need to perform a benchmark on a contemporary sample of projects that are representative of the typical work that we do. In this webinar, industry expert Larry Putnam, Jr. will take you through the necessary steps to perform a successful benchmark - from collecting quantitative and qualitative data to establish the initial baseline benchmark all the way through to performing follow up benchmarks on new projects and process improvement analysis.

Larry Putnam, Jr. has 25 years of experience using the Putnam-SLIM Methodology. He has participated in hundreds of estimation and oversight service engagements, and is responsible for product management of the SLIM Suite of software measurement tools and customer care programs. Since becoming Co-CEO, Larry has built QSM's capabilities in sales, customer support, product requirements and most recently in creating a world class consulting organization. Larry has delivered numerous speeches at conferences on software estimation and measurement, and has trained - over a five-year period - more than 1,000 software professionals on industry best practice measurement, estimation and control techniques and in the use of the SLIM Suite.

Blog Post Categories 
Webinars Benchmarking Process Improvement

Effort: What's Behind that Number?

Effort seems like a metric that's very straightforward, but there is a lot of complexity here, particularly if you are performing benchmark analysis. Recently, I was tapped to help out with a benchmark assessment. One of the metrics that the customer wanted to analyze was effort per function point. "Effort" on its own is very vague, and while the customer might know which phases or activities his organization uses, I can't be sure that definition will match what I think he wants. In order to effectively benchmark, we need to make an apples-to-apples comparison by examining what is really behind the effort number, so it was necessary to send the client phase and activity definitions. 

Here are some helpful definitions to help you understand which activities are included in each phase: 

Concept DefinitionThe earliest phase in the software life cycle, where complete and consistent requirements and top-level, feasible plans for meeting them are developed.

The objectives of this phase are to develop a complete and technically feasible set of requirements for the system and to formulate the top-level approach and plan for their implementation.  Typical products of these activities include:

Blog Post Categories 
Benchmarking Effort