SLIM Note Panel Simplifies Reports, Documentation, and Guidelines
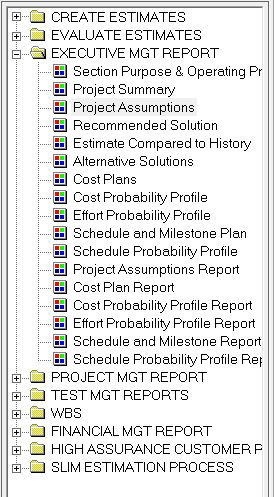
SLIM Suite default workbooks contain pre-defined views you can customize to fit your reporting needs. The Navigation Panel on the left side of the user interface displays the list of views, organized into sections or folders. Each SLIM tool contains multiple views to facilitate presentation and analysis of the unique metrics it employs.

Figure 1: Navigation Panel
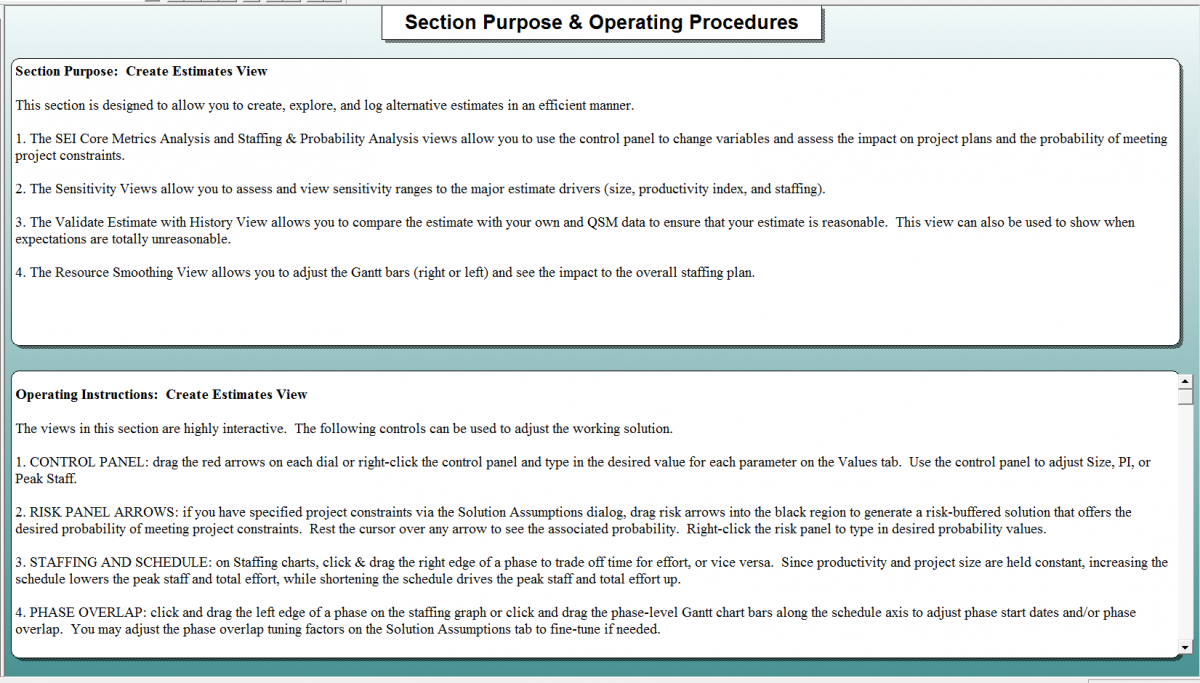
One of the most valuable and flexible objects to include in a view is the Note Panel. Just as it sounds, it is simply a note pad where you can include descriptive text about estimation assumptions, findings, questions, instructions to SLIM users.... the possibilities are numerous. QSM uses the Note Panel to provide instructions, tips, and easily customizable project and executive summary reports. The view below shows the Section Purpose & Operating Procedures view, which describes other views in the folder, along with suggestions for tailoring subsequent charts and reports.

Figure 2: Note Panel View
You can use notes to document the estimation procedure you want others in your organization to follow. Use notes to document the special background information that explains why the recommended solution meets the most important project goals and constraints.

