Languages

Languages

White Paper: Long Term Trends from 40 Years of Completed Software Project Data

Software Project Size over Time

Although the software industry is known for growth and change, one thing has remained constant: the struggle to reduce cost, improve time to market, increase quality and maintainability, and allocate resources most efficiently. So how can we combat future challenges in a world where everything is software, from the systems in your car to the thermostat in your home to the small computer in your pocket? By using practical measurement and metrics, we can get a bird's-eye view of where we've been and where we could go, while keeping us grounded in data. Leveraging QSM's industry database of over 13,000+ completed projects, Katie Costantini takes a high-level look at changes to software schedules, effort/cost, productivity, size, and reliability metrics from 1980 to 2019. The current study compares insights to similar studies QSM has completed at regular intervals over the past four decades and answers questions like, 'what is the "typical" project over time?' and 'why are projects "shrinking?"' The results may surprise you!

Read the full white paper!

Top Programming Languages Revisited

Mike Harris at the Davis Consulting Group blog links to a 2014 list of 11 Essential Programming Languages from Baseline Magazine:

If you want to learn about the hottest programming languages today, don't miss this list from IEEE Spectrum. This respected organization, which has 400,000 members and is considered the world's largest association of technology professionals, enlisted the services of Nick Diakopoulos, a well-known computational journalist and assistant professor at the University of Maryland, to compile the language rankings. Diakopoulos proceeded by weighing and combining 12 metrics from 10 sources, including IEEE Xplore, Google and GitHub. The result is a compilation of languages that cover big data analytics, graphics, system administration, network programming and virtually every other tech-supported function.

IEEE’s interactive list, which you can explore here, generates customized rankings for various sectors (Web, embedded, enterprise). In evaluating the results, it makes sense to ask, “What makes a programming language, ‘essential’?” Language popularity can be measured several ways:

Blog Post Categories 
Languages QSM Database

The "Typical Software Project" Over Time

What does a typical software project in the QSM historical database look like, and how has “what’s typical” changed over time? To find out, we segmented our IT sample by decade and looked at the average schedule, effort, team size, new and modified code delivered, productivity, language, and target industry for each 10 year time period.

The QSM benchmark database represents:

  • 8,000+ Business projects completed and put into production since 1980.
  • Over 600 million total source lines of code (SLOC).
  • 2.6 million total function points.
  • Over 100 million person hours of effort.
  • 600+ programming languages.

During the 1980s, the typical software project in our database delivered 154% more new and modified code, took 52% longer, and used 58% more effort than today’s projects.   The table below captures these changes:

Blog Post Categories 
Team Size Languages QSM Database Effort

Top 25 Programming Languages since 2008

Top 25 Programming Languages since 2008

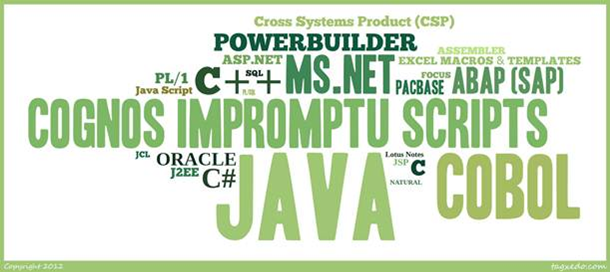
In response to my previous post, I made a new word cloud for the top 25 programming languages in the QSM historical database from 2008 to present.

One striking difference between this word cloud and the last week's is that the font sizes are much smaller, due to the smaller sample size. Since word clouds use font size to represent size within a sample, this is expected since the entire QSM database is larger than the sample from 2008 to present. 

Unlike last week's cloud, Java is the predominant programming language since 2008. Java represents 26% of the sample since 2008 while COBOL, the #1 programming language in the entire database, holds only 11% of this sample. According to Langpop.com, a site which ranks the popularity of programming languages using search results, Java ranks second in the Normalized Comparison chart, just below C.  

In Programming Language Trends: An Empirical Study, a paper from the New Jersey Institute of Technology, the authors attempt to predict the popularity of programming languages by using regression analysis which focuses on intrinsic and extrinsic factors.  

Blog Post Categories 
Languages QSM Database

Top 25 Programming Languages Visualized

Top 25 Programming Languages

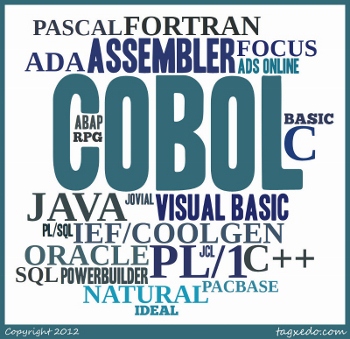
Since I began working with SLIM-Metrics and the QSM historical database, I've been interested in unique ways to present information.  I've written before about how others pair data and design to visualize patterns, but this is my first attempt: a word cloud.  

A word cloud is a graphical representation of how often a word is used within a sample.  The larger the font in the word cloud, the more often it is used in the sample.  Word clouds are a great tool for displaying sensitive data without having to use numbers.  The above word cloud visualizes the entire QSM database, going back three decades.

What I like about this visualization is that at a glance, you can tell that more projects use PL/1 than Natural, simply by examining font size.  Even without knowing exactly how many Java projects are in the QSM database, you can still determine that it's more than Visual Basic, but less than COBOL. 

Unsurprisingly, COBOL still has a large market share in the QSM database.  Most COBOL projects completed after 2000 were maintenance projects, not new development. 

Blog Post Categories 
SLIM-Metrics Languages QSM Database

Determining The Market Share of Popular Programming Languages

On Linked In, Peter Hill reports on current "programming languages of choice" in the ISBSG database:

"Java and C# .Net are now the languages of choice in the projects that the ISBSG receives. COBOL has slumped to 12% (it used to be 38%) and Visual Basic has dropped back to 5% after peaking at 15%."

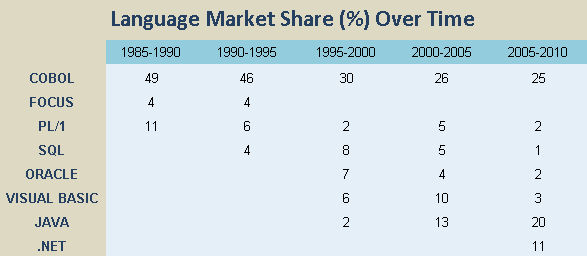
I thought it might be interesting to find out how the "market share" for popular programming languages has changed over time. The first task was to stratify Business projects from the QSM database into 5 bins using the year the systems were put into production. Only medium and high confidence projects with language data were used. Sample sizes ranged from about 600-1200 projects with most year bins containing around 1000 projects.

For each year bin, I determined the "market share" (% of total projects in each bin) for various programming languages. Each bin spans 5 years (1985-1990, 1990-1995 and so on). 

The durability of COBOL surprised me a bit. The vast majority (>75%) of the COBOL projects put into production between 2005 and 2010 were major/minor enhancements of existing systems or maintenance releases, but despite their dwindling market share, COBOL systems appear to be the Energizer Bunnies of the software world - they just keep going, and going, and going....

Market Share for Various Programming Languages

Blog Post Categories 
Languages