Kate Armel's blog

Kate Armel's blog

New Faces in QSM Support

The next time you call or email QSM for support, you may notice a few unfamiliar names or voices. That's because QSM Research and Support is growing!

The first addition to our team is Katie Costantini. Katie joined QSM as a temporary summer intern in May of this year. We were so delighted by the quality of her work that we recently offered her a full time position at QSM as a Technical Support and Documentation specialist.

Katie Costantini joins QSM Research and Technical Support with three years of customer service experience under her belt. Over the summer, she has been working hard to upgrade our product documentation to a newer platform and format. You'll see some of her work in the next edition of SLIM-Suite manuals and help. She also assisted with the redesign of our new FAQs page and has been helping us revamp our ramp up documentation and processes. Katie graduated from Virginia Commonwealth University cum laude with a B.S. in Economics and a minor in Latin and Roman Studies. Raised in a Marine Corps family (ooh rah!), Katie has lived in California, North Carolina, Virginia, and Cairo, Egypt.

Over the next year, Kate will be working on support documentation and the next update of the QSM database and industry trend lines. Her strong quantitative background and stellar organizational skills are already helping us bring about some exciting changes that we'll be unveiling soon!

The second (chronologically speaking) addition to QSM Research & Support is Laura Zuber:

Blog Post Categories 
QSM News Support

An In-Depth Look at the QSM Database

The QSM Database is the cornerstone of our tools and services, so our clients and prospects often ask for more information regarding the data and types of projects represented. This blog post addresses some frequently asked questions about the QSM Database.

Sources of Data

Since 1978, QSM has collected completed project data from licensed SLIM-Suite® users and trained QSM consulting staff. Consulting data is also collected by permission during productivity assessment, benchmark, software estimation, project audit, and cost-to-complete engagements. Many projects in our database are subject to non-disclosure agreements but regardless of whether formal agreements are in place, it is our policy to guard the confidentiality and identity of clients who contribute project data. For this reason, QSM releases industry data in summary form to preclude identification of individual projects/companies or disclosure of sensitive business information.

Data Metrics

Our basic metric set focuses on size, time, effort, and defects (SEI Core Metrics) for the Feasibility, Requirements/Design, Code/Test, and Maintenance phases. These core measurements are supplemented by nearly 300 other quantitative and qualitative metrics. Approximately 98% of our projects have time and effort data for the Code and Test phase and 70% have time/effort data for both the R&D and C&T phases.

Productivity is captured via the following metrics:

QSM Productivity Index (PI)
Cost per SLOC or Function Point
SLOC or Function Points per month
SLOC or Function Points per Effort Unit (Months, Hours, Days, Weeks, Years)

Quality data is captured via the following metrics:

Blog Post Categories 
Metrics QSM Database

Check Out Our New FAQs Page!

If you haven't already done so, now is a great time to check out our new Frequently Asked Questions page!

Over the summer, our Intrepid Support Intern Katie revised, updated, or rewrote over 80 frequently asked questions and we've redesigned the FAQs page to make it easier to use. You can browse FAQs by category or enter search your own custom search terms in the Search box.

Can't find what you're looking for? Just email QSM Support - we'll be happy to assist!


Determining The Market Share of Popular Programming Languages

On Linked In, Peter Hill reports on current "programming languages of choice" in the ISBSG database:

"Java and C# .Net are now the languages of choice in the projects that the ISBSG receives. COBOL has slumped to 12% (it used to be 38%) and Visual Basic has dropped back to 5% after peaking at 15%."

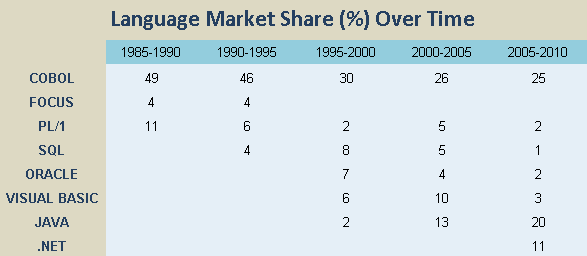
I thought it might be interesting to find out how the "market share" for popular programming languages has changed over time. The first task was to stratify Business projects from the QSM database into 5 bins using the year the systems were put into production. Only medium and high confidence projects with language data were used. Sample sizes ranged from about 600-1200 projects with most year bins containing around 1000 projects.

For each year bin, I determined the "market share" (% of total projects in each bin) for various programming languages. Each bin spans 5 years (1985-1990, 1990-1995 and so on). 

The durability of COBOL surprised me a bit. The vast majority (>75%) of the COBOL projects put into production between 2005 and 2010 were major/minor enhancements of existing systems or maintenance releases, but despite their dwindling market share, COBOL systems appear to be the Energizer Bunnies of the software world - they just keep going, and going, and going....

Market Share for Various Programming Languages

Blog Post Categories 
Languages

2011 IT Maintenance and Offshoring Survey


QSM  invites developers of financial services and Business/IT applications to participate in their 2011 IT Maintenance and Offshoring Survey. Software development organizations are always curious about how they stack up against the industry. With your help, we hope to provide insight into how major software developers budget, staff, and measure their maintenance and offshore development. Key analysis areas include:

  • How much do IT shops typically spend on application maintenance vs. new development/enhancements?
  • What project types and skills are most likely to be offshored?
  • How does offshore development stack up in terms of productivity and quality?
  • What are the challenges and constraints of the offshore development environment?

At the conclusion of the survey, participants will receive an electronic copy of the QSM IT Almanac and a free industry summary report that analyzes typical development vs. maintenance budgets and offshore spending and resource mixes by software function, platform, and skill.

Who should complete the survey?
This survey is primarily focused on major financial services software firms, but IT systems developers are also welcome to participate.

Survey Timeline
The survey will begin Monday, April 18th and close on Friday, April 29th, 2011.

Blog Post Categories 
Surveys Offshoring

Simpson's Paradox

Last week we looked at IT software productivity trends for 1000 completed IT systems and noted that average productivity has declined over the last 15 years.

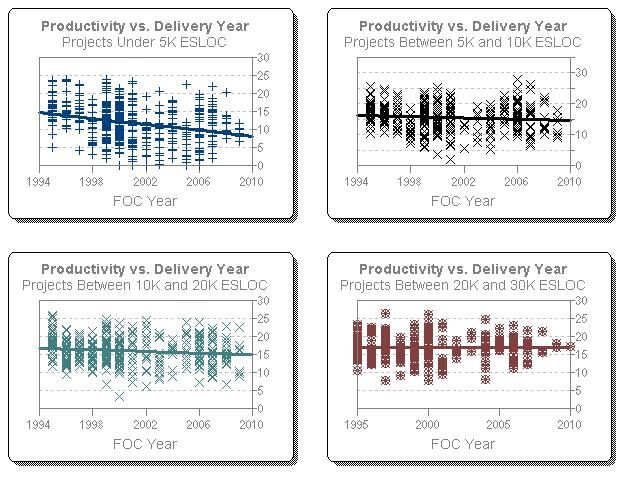
The post sparked some interesting responses. Two readers wanted to know whether productivity actually increases over time for projects in the same size range? If so, this would be an illustration of Simpson's Paradox: a counterintuitive phenomenon we've seen from time to time in our own research. Simply put, sometimes the direction of a trend is reversed when the sample is broken into categories.

To answer their question, I used our SLIM-Metrics tool to stratify the sample into four size bins:

Under 5000 Effective (new + modified) SLOC
5000- <10000 Effective (new + modified) SLOC
10000-<20000 Effective (new + modified) SLOC
20000-<30000 Effective (new + modified) SLOC

These 4 size bins span a little over two thirds of the data. As a sanity check, I applied the same queries to both the original sample of 1000 IT projects and a larger sample of nearly 2200 IT projects. As the following chart shows, stratifying the data into size bins doesn't affect the overall direction of the trend:

Productivity over Time

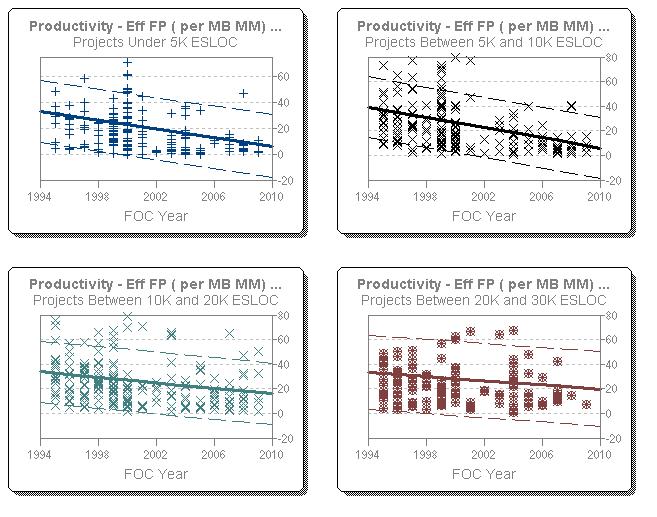
For conventional productivity (FP/Person Month) the decline in productivity was even more pronounced:

FP per PM over time

Blog Post Categories 
Metrics Benchmarking Productivity

Technology As A Hidden Productivity Killer

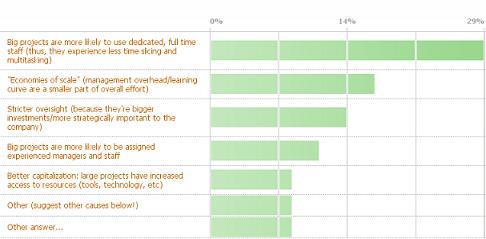
Here are the results as of 3 pm today for our productivity poll. I was surprised to see that "Time slicing and multi-tasking" was far and away the most popular response!

Productivity poll

When I framed the poll question, I was thinking of time slicing by policy (i.e., where management asks a single person to divide his time/attention between multiple projects). Viewed from a cost perspective, such assignments make perfect cents [pun fully intended] - especially for small or poorly capitalized projects. But from a productivity perspective, the constant distractions inherent in this kind of multi-tasking can result in less than optimal performance. 

Carol Dekkers made me think of another possible explanation for the declining productivity we've seen over the last 15 years: the distraction of 24/7 online communication. 

Since joining the world of social media I realize my “connectivity” has grown exponentially, but not all in a good way. Even with my SPAM filters set to high, I get so much email that it is overwhelming!

 I feel like I must have ADD (attention deficit disorder) because my day is interruption after interruption (sorry TweetDeck!) and I need help (and I know I am not the only one!)

Blog Post Categories 
Productivity Polls

QSM at SEPG

If you're planning on attending this year's SEPG conference, don't miss QSM Consultant, researcher, and all around blogger extraordinaire Paul Below! On Wednesday, March 23rd, Paul will demonstrate how organizations can Maximize Value by Understanding the Productivity Paradox and Predicting Reliability:

Now more than ever, software projects need to efficiently deliver reliable software. However, many development plans unintentionally guarantee a less-than-optimal result. This presentation uses historical result metrics to describe how to maximize value by establishing minimum acceptable reliability and how to take advantage of the apparent paradox between software size and productivity through appropriate selection of team size and schedule duration.

If you've enjoyed Paul's posts here, make sure you stop by and say hello!


Blog Post Categories 
QSM News

Poll: Why Does Productivity Increase With System Size?

On our Software Productivity Declines Over Time post, ISBSG's Peter Hill left an interesting comment:

... your findings that 'average productivity increases with project size' might raise a few eyebrows, but the ISBSG data produces the same finding. Of course we only have data on projects that were completed. I wonder about the incidence of abandonment of large projects.

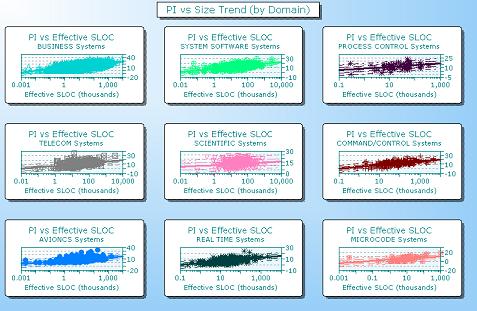
The QSM database shows a positive correlation between system size and productivity. The following chart shows PI vs. System Size regression fits for 9 different application domains (Business, System Software, Process Control, Telecom, Scientific, Command & Control, Avionics, Microcode, and Real Time). Regardless of domain, average productivity increases with system size:

PI vs Size Regression - All Domains

View larger image

In the SLIM-Estimate user's guide, we speculate about possible explanations for the relationship between productivity and system size:

Small systems tend to have lower average PIs than large systems. We can only speculate as to the reasons, but two important influences may be management influence (the way large and small systems are planned, managed, and funded) and economies of scale.

Blog Post Categories 
Productivity Polls

The Housework Theory of Productivity

Since we're speculating about why (in the aggregate at least) software productivity appears to have declined over time, here's another possible cause. I call it The Housework Theory of Productivity.

Scrubbing bubbleBack in great-Grandma's time, cleaning was a labor intensive endeavor. Rugs were swept once or twice a week and taken outside and beaten by hand once a year. Those cheery little scrubbing bubbles weren't around to whisk the pesky soap scum from our bathtubs - they hadn't been invented yet. When it came to cleaning, our aspirations were limited by the time and effort required to complete even the simplest tasks.

Over time various "labor saving" devices ushered in heretofore unheard of levels of springtime fresh cleanliness. But there was a downside to these advances: as our ability to get things clean increased, so did our expectations. The work expanded to fill the time (and energy) available to us.

If we were to compare two software projects that are same size and perform the same function (but were completed 20 years apart), we'd likely find the modern billing system smaller in size but far richer in features. It would also be more complex, both from an algorithmic and an architectural standpoint. Because today's programming tools and languages make it possible to deliver more value per line of code or function point, our standards have risen. We expect more for our time and money.

Blog Post Categories 
Productivity