Database

Database

Data-Less Decision Making

I rather enjoyed the Google Analytics April Fools prank earlier this month, Welcome to Data-Less Decision Making on Analytics Academy.  Though satirical, this video brings to light an important reason why individuals have such trouble making decisions in a business environment: they don’t have data.

I’ll agree that without data it’s really appealing to turn to the coin flip method and be done with it.  After all, 50/50 odds really aren’t terrible, right?  But project management software such as SLIM-Estimate make empirically-based business decisions possible, even when company data isn’t immediately available.

Leveraging our database that contains over 10,000 projects, QSM has developed and regularly updates 17 distinct industry trends.  When creating an estimate or benchmarking a past performance, simply select the QSM industry trend that most closely reflects the type of system being built.  This will serve as a reference point.

If historical data is available but you’re unsure of which metrics to collect, SLIM-SmartSheets is a new downloadable feature in SLIM version 8.2 that mimics the look and feel of SLIM-DataManager and allows users to collect project data, even when they’re not on a network computer.  Each project can then be pulled into one SLIM-DataManager file using the API.  
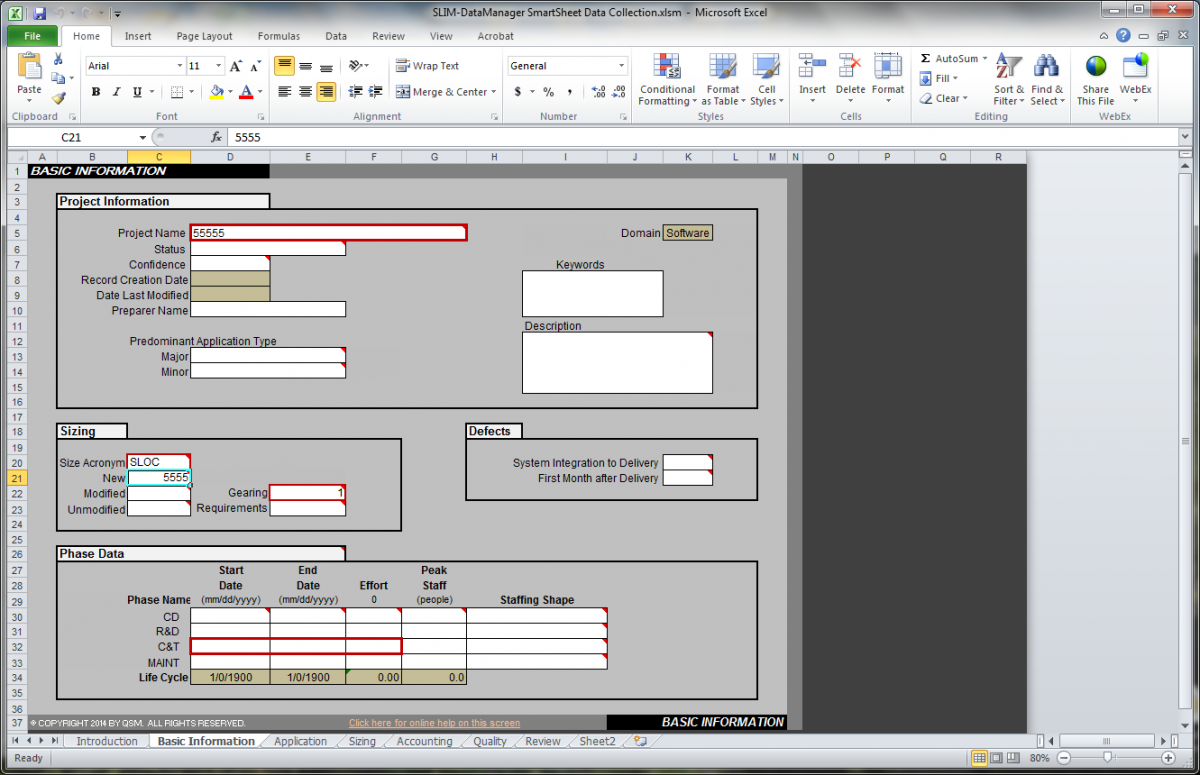
SLIM-SmartSheets

Ask Carol: How Many Projects Create a "History?"

Dear Carol:

As a project manager who is new to formal project estimating, I’ve been hearing about the importance of having project histories available for accurate estimating.  We just purchased SLIM-Estimate but we don’t have any project history.  Can we still use SLIM, and how many projects do we need before we can get accurate estimates?

– PM in Atlanta

Dear PM:

You may have heard that “history repeats itself” and the adage is true in software development.  Completed projects where the actual software size, effort hours, duration and cost are often the best predictors of future performance on projects – and your own project history gives accurate indicators of how your corporation performs.  However, the majority of QSM clients who purchase SLIM-Estimate start out with little or none of their own project history.  The good news is that the SLIM tool comes preloaded with productivity, duration, staffing, and effort hours trend lines based on thousands of completed real life projects, and delineated by industry and type of project.  When you do an estimate using SLIM, the Monte Carlo simulation models are run, and the results are compared against trend line graphs so that you can see how your estimate of effort, duration, staffing and cost compare to the chosen industry.  This gives you the confidence to know where your estimate falls against comparable completed projects (of a given size.) If your estimates fall outside the bounds of a single standard deviation above or below the industry trend lines, you know that you may want to reassess the assumptions of your estimate.

Blog Post Categories 
SLIM-Estimate Database Ask Carol

Fundamentals of Software Metrics in Two Minutes or Less

A couple of years ago at a lean software and systems conference, I delivered a “lightning talk” about software metrics. In the two-minute time span, I illustrated the folly of gathering data without a measurement plan and the audience grasped the concept immediately.  “Why don’t more companies get this?” remarked several attendees, “it just doesn’t make sense to collect all the data we do without a plan.”

It doesn’t take a rocket scientist to succeed with software measurement; professionals with a straightforward plan can quickly and easily reap its benefits. Two concepts are fundamental to embrace for metrics success:  1. Goal-Question-Metric (GQM), and 2. Simplicity.  

Goal-Question-Metric (GQM) Approach to Metrics

First introduced by Victor Basili as an approach to measurement, and later the subject of a book by the same name by Rini vanSoligen and Egon Berghout, GQM is a straight-forward, stepwise approach to measurement.  While it has applicability to measurement in any industry, Basili created GQM specifically to address the chaos in the software world.  GQM involves three steps:

  1. Establish the Goals for measurement.
  2. Ask the Questions that will answer whether the goals are being met.
  3. Design and collect the Metrics to answer the questions.

The Software Engineering Institute (SEI) at Carnegie Mellon University in Pittsburgh, PA expanded Victor Basili’s GQM approach to GQIM, the “I” being indicator, but that is the topic of a future post.

Blog Post Categories 
Metrics Database

How to Use Big Data to Improve Your Software Projects

In the recent Washington Post article How the Obama Campaign Won the Race for Voter Data, Joel Kowsky writes about how the 2012 Obama campaign used analytics to improve their campaign strategy, and to ultimately secure the presidential victory.  

Regardless of where you stand on the political spectrum, it’s hard to argue that Barack Obama’s campaign strategy was anything short of impressive.  As soon as Obama took office in 2009, his team began preparing for his 2012 campaign.  From the start there was a strong emphasis on measuring the campaign’s progress.  Jim Messina, Obama’s 2012 campaign manager, stated 

“There’s always been two campaigns since the Internet was invented, the campaign online and the campaign on the doors.  What I wanted was, I didn’t care where you organized, what time you organized, how you organized, as long as I could track it, I can measure it, and I can encourage you to do more of it.”

The team began by conducting a postmortem study on their 2008 campaign where they analyzed the number of homes visited, phone calls placed, and voters registered by each field organizer and volunteer.  The result was a 500 page report which highlighted areas of improvement for the 2012 campaign.  

The suggestions led the Obama campaign to invest in building customized software that would integrate all the data the campaign had collected on voters, donors, and volunteers and link to individual voter profile.  This software analyzed previously collected data to calculate the likelihood of candidate support, the likelihood of election day turnout, and the degree of persuasion for each voter.  

Database Validation Best Practices

Database validation is an important step in ensuring that you have quality data in your historical database.  I've talked before about the importance of collecting project data and what you can do with your own data, but it all hinges on having thoroughly vetted project history.

Although it's nice to have every tab in SLIM-DataManager filled out, we really only need three key pieces of information to calculate PI:

  • Size (Function Unit): if the function unit is not SLOC, a gearing factor should be provided (97.3% of projects in the database report total size)
  • Phase 3 duration or start and end dates (99.9% of projects in the database report phase 3 duration)
  • Phase 3 effort (99.9% of projects in the database report phase 3 effort)

These fields can be thought of as the desired minimum information needed, but even if one is missing, you may not want to delete the project from the database. A project that is missing effort data, for instance, will not have a PI but could be used to query a subset of projects for average duration by size. Likewise, a project with no size will not have a PI, but does contain effort and duration information that could be useful for calculating the average time to market for a division. However, if possible, it is a good idea to fill out at least these three fields.

Blog Post Categories 
SLIM-Metrics Data SLIM-DataManager Database

Why Are Conversion Projects Less Productive than Development?

While doing research on projects counted in function points, the sample size was large enough (over 2000 projects) to allow me to compare the productivity of different project types.  The QSM database uses these project categories:

  • New Development (> 75% new functionality)
  • Major Enhancement (25% - 75% new functionality)
  • Minor Enhancement (5% - 25% new functionality)
  • Conversion (< 5% new functionality)
  • Maintenance

I calculated the normalized PI’s for projects in each development classification compared to the QSM Business trend lines.  The advantage of this is that it takes into consideration the impact of size and shows how the productivity of each project “application type” differs from the QSM Business IT average.  The datasets included medium and high confidence IT projects completed since 2000.  When I obtained the results, I went back over my selection process and calculations to make sure I hadn’t made a mistake.  The numbers were that surprising.  But, no, I hadn’t fat fingered anything (neither physically nor mentally).  Average productivity for conversion projects  was more than a standard deviation below the QSM Business IT average.

Blog Post Categories 
SLIM-Estimate Function Points Database