Metrics

Metrics

Fundamentals of Software Metrics in Two Minutes or Less

A couple of years ago at a lean software and systems conference, I delivered a “lightning talk” about software metrics. In the two-minute time span, I illustrated the folly of gathering data without a measurement plan and the audience grasped the concept immediately.  “Why don’t more companies get this?” remarked several attendees, “it just doesn’t make sense to collect all the data we do without a plan.”

It doesn’t take a rocket scientist to succeed with software measurement; professionals with a straightforward plan can quickly and easily reap its benefits. Two concepts are fundamental to embrace for metrics success:  1. Goal-Question-Metric (GQM), and 2. Simplicity.  

Goal-Question-Metric (GQM) Approach to Metrics

First introduced by Victor Basili as an approach to measurement, and later the subject of a book by the same name by Rini vanSoligen and Egon Berghout, GQM is a straight-forward, stepwise approach to measurement.  While it has applicability to measurement in any industry, Basili created GQM specifically to address the chaos in the software world.  GQM involves three steps:

  1. Establish the Goals for measurement.
  2. Ask the Questions that will answer whether the goals are being met.
  3. Design and collect the Metrics to answer the questions.

The Software Engineering Institute (SEI) at Carnegie Mellon University in Pittsburgh, PA expanded Victor Basili’s GQM approach to GQIM, the “I” being indicator, but that is the topic of a future post.

Blog Post Categories 
Metrics Database

Project Metrics Are the Best Defense in the Battle Against Scope Creep

Scope creep is a frequent topic of discussion among project management professionals.  A recent Project Management Institute (PMI)® i Community Post, Fighting the Dreaded Scope Creep, reported some responses PMI members offered as their weapon of choice.  The various suggestions can be summarized by two general practices:

  • Avoid making on-the-spot decisions (uninformed or politically motivated)
  • Communicate the impact of the change to stakeholders and let them decide (analyze the cost, schedule, and risk impact)

Regardless of the specific practice, all of the recommended defenses included some process for change control.

I like words.  When I need to understand a topic, I pull the dictionary off the shelf (or access the online version), and look at the basic definition.  To determine why scope creep is such a formidable enemy, I looked up the word “creep”:  2. to approach slowly, imperceptibly, or stealthily; 4. to sneak up behind someone or without someone's knowledge.  A vast majority of results from a general internet search defined scope creep as “uncontrolled change.” 

Blog Post Categories 
Sizing Metrics

Achieving Goals Begins with Successful Measurement

“You can’t know where you’re going until you know where you’ve been.”

At this point, we’re about one month into 2013 and many of us have abandoned our New Year’s resolutions.  Personally, I prefer to set my yearly goals about a month in because it gives me some time to reflect on what I really want to improve without being distracted by everyone’s bandwagon resolutions like getting in shape or eating less junk food.

The other reason I prefer to wait a month before resolving to do anything is because it gives me time to collect some baseline data.  In his Wall Street Journal article, Bill Gates writes, that “you can achieve incredible progress if you set a clear goal and find a measure that will drive progress toward that goal.”

To use the common example of getting in shape, I’m going to explain:

  1. How to set a goal, and
  2. How to measure it so that you can effectively achieve your goal.

First you need to set a baseline measure of what your abilities are.  How fast and far can you run?  How much weight can you lift?  How much do you weigh?  Knowing the answers to these questions can help you determine what needs improvement.  

Next you need to identify your end goal and find a way to quantify progress towards that goal.  What does “get in shape” actually mean?  Do I want to be able to run faster?  Farther?  Do I want to be able to lift more weight?  Do I want to weigh less?  All of these goals can be quantified (e.g. I want to be able to run a mile 30 seconds faster than I currently do, I want to run a 10 miler, I want to be able to bench press 100 pounds, I want to lose 20 pounds).

How's Your Metrics Program Doing?

"Everything should be made as simple as possible, but not simpler."

-  Albert Einstein

How’s your software measurement program doing?  Is it well funded and supported by management, or do you worry about your job the next time the organization decides it needs to be “leaner and meaner”?  Many measurement programs are cancelled or fade into meaningless obscurity.  Why?  Some things are out of your control; but here are a few that will improve your odds for success:

Blog Post Categories 
Metrics Benchmarking

An In-Depth Look at the QSM Database

The QSM Database is the cornerstone of our tools and services, so our clients and prospects often ask for more information regarding the data and types of projects represented. This blog post addresses some frequently asked questions about the QSM Database.

Sources of Data

Since 1978, QSM has collected completed project data from licensed SLIM-Suite® users and trained QSM consulting staff. Consulting data is also collected by permission during productivity assessment, benchmark, software estimation, project audit, and cost-to-complete engagements. Many projects in our database are subject to non-disclosure agreements but regardless of whether formal agreements are in place, it is our policy to guard the confidentiality and identity of clients who contribute project data. For this reason, QSM releases industry data in summary form to preclude identification of individual projects/companies or disclosure of sensitive business information.

Data Metrics

Our basic metric set focuses on size, time, effort, and defects (SEI Core Metrics) for the Feasibility, Requirements/Design, Code/Test, and Maintenance phases. These core measurements are supplemented by nearly 300 other quantitative and qualitative metrics. Approximately 98% of our projects have time and effort data for the Code and Test phase and 70% have time/effort data for both the R&D and C&T phases.

Productivity is captured via the following metrics:

QSM Productivity Index (PI)
Cost per SLOC or Function Point
SLOC or Function Points per month
SLOC or Function Points per Effort Unit (Months, Hours, Days, Weeks, Years)

Quality data is captured via the following metrics:

Blog Post Categories 
Metrics QSM Database

Beyond the Hype: Thoughts on Agile Development

I'm pleased to make available "Beyond the Hype," a presentation that I delivered at the 2011 Practical Software and Systems Measurement Conference.  "Beyond the Hype" is a metrics-based analysis of Agile development that both confirms some “common wisdom” and contains a few surprises.  Does Agile really have higher productivity?  How does Agile quality compare with traditional development?  What are Agile’s demonstrated strengths and weaknesses?  How can you size and track Agile projects?  Using Agile project data from the QSM Database, "Beyond the Hype" addresses these and other questions about Agile.

Read the full presentation here.

Blog Post Categories 
Metrics Agile

Simpson's Paradox

Last week we looked at IT software productivity trends for 1000 completed IT systems and noted that average productivity has declined over the last 15 years.

The post sparked some interesting responses. Two readers wanted to know whether productivity actually increases over time for projects in the same size range? If so, this would be an illustration of Simpson's Paradox: a counterintuitive phenomenon we've seen from time to time in our own research. Simply put, sometimes the direction of a trend is reversed when the sample is broken into categories.

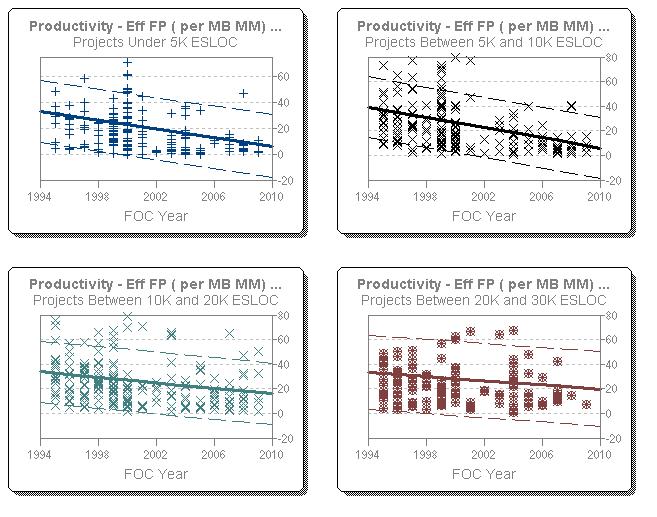
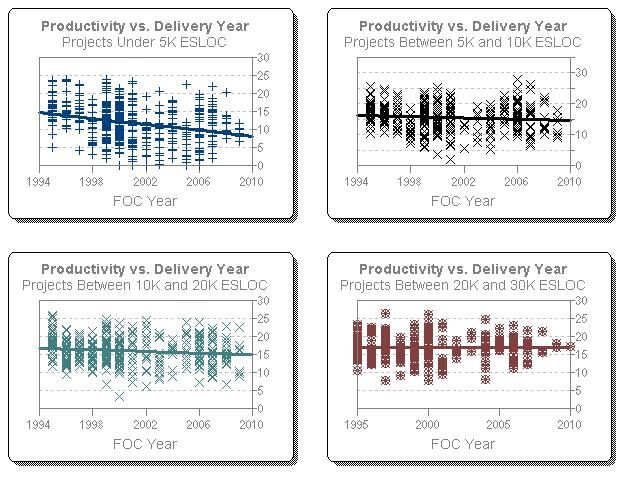
To answer their question, I used our SLIM-Metrics tool to stratify the sample into four size bins:

Under 5000 Effective (new + modified) SLOC
5000- <10000 Effective (new + modified) SLOC
10000-<20000 Effective (new + modified) SLOC
20000-<30000 Effective (new + modified) SLOC

These 4 size bins span a little over two thirds of the data. As a sanity check, I applied the same queries to both the original sample of 1000 IT projects and a larger sample of nearly 2200 IT projects. As the following chart shows, stratifying the data into size bins doesn't affect the overall direction of the trend:

Productivity over Time

For conventional productivity (FP/Person Month) the decline in productivity was even more pronounced:

FP per PM over time

Blog Post Categories 
Metrics Benchmarking Productivity

Technology Can Only Do So Much

It’s hard to believe it’s been 36 years since an IBM manager named Fred Brooks came out with his seminal insights about software development, the most famous of which ("adding more people to a late software project makes it later") came to be known as Brooks’ Law. These days, most software professionals accept and appreciate Brooks’ analysis, yet we continue to make the very mistakes that prompted him to write The Mythical Man Month!

Which leads to an interesting question: armed with such a clear and compelling argument against piling on staff at the last minute, why do we repeatedly employ a strategy that not only fails to achieve the hoped-for schedule reductions but often results in buggy, unreliable software?

The most likely answer combines schedule pressure with the human tendency to over-optimism. Basing plans on hope rather than experience is encouraged by a constant parade of new tools and methods. Faced with the pressure to win business, please customers and maintain market share, is it really surprising that new  technologies tempt us to discount the past and hope that – if we use this tool, this team, this methodology - this project will be different?

How can software developers counter the human tendency to fall for overly optimistic estimates and unachievable schedules?

What's needed is perspective: the kind of perspective that comes from honestly examining - and reminding ourselves - how things have worked in the past. In a paper called, “Technology Can Only Do So Much”, I look at the human and technological factors that trip up so many software projects.  Good historical data provides a sound empirical baseline, against which both conventional wisdom and future plans can be assessed.


Blog Post Categories 
Metrics Team Size Estimation

An Empirical Examination of Brooks' Law

Building on some interesting research performed by QSM's Don Beckett, I take a look at how Brooks' Law stacks up against a sample of large projects from our database:

Does adding staff to a late project only make it later? It's hard to tell. Large team projects, on the whole, did not take notably longer than average. For small projects the strategy had some benefit, keeping deliveries at or below the industry average, but this advantage disappeared at the 100,000 line of code mark. At best, aggressive staffing may keep a project's schedule within the normal range of variability.

Contrary to Brooks' law, for large projects the more dramatic impacts of bulking up on staff showed up in quality and cost. Software systems developed using large teams had more defects than average, which would adversely affect customer satisfaction and, perhaps repeat business. The cost was anywhere from 3 times greater than average for a 50,000 line of code system up to almost 8 times as large for a 1 million line of code system. Overall, mega-staffing a project is a strategy with few tangible benefits that should be avoided unless you have a gun pointed at your head. One suspects some of these projects found themselves in that situation: between a rock and a hard place.

How do managers avoid these types of scenarios? Software development remains a tricky blend of people and technical skills, but having solid data at your fingertips and challenging the conventional wisdom wisely can help you avoid costly mistakes.

Read the full post here.

Blog Post Categories 
Metrics Team Size