SLIM-Control

SLIM-Control

Can We Increase Project Success by Tracking the Big Picture?

Many of the project managers that I speak with track their software and systems projects at a very detailed level. They use detailed spreadsheets or other tools to track hours and tasks on a daily basis. This is fine, but it's important to manage the big picture so we can avoid assigning detailed tasks to duration and budget goals that are unrealistic.

By "big picture" I mean tracking at the project release level and focusing on a few key actuals: size, duration, effort, reliability, and efficiency. It's important to track these actuals to a reliable plan. These are the measures that can give us the biggest and quickest insight into a project’s potential success or failure. You can see this analysis in the SLIM-Control graphs below, showing the blue plans versus the red actuals.

Software Project Tracking

Once the project is underway and we start tracking the actuals, we can generate new project forecasts based on the actual work delivered, time elapsed, and effort spent. These new forecasts are empirically-based. This will enable us to adapt to change requests, see when the project will finish and how much it will cost. The SLIM-Control graphs below show the blue plans versus the red actuals plus the new forecasts shown in white. SLIM-Control is curve-fitting to the actuals and running empirically-based mathematical models to generate the new forecasts.

Software Project Forecast

Blog Post Categories 
Project Management SLIM-Control

Resource Demand Management - Are the Right People Working on the Right Thing?

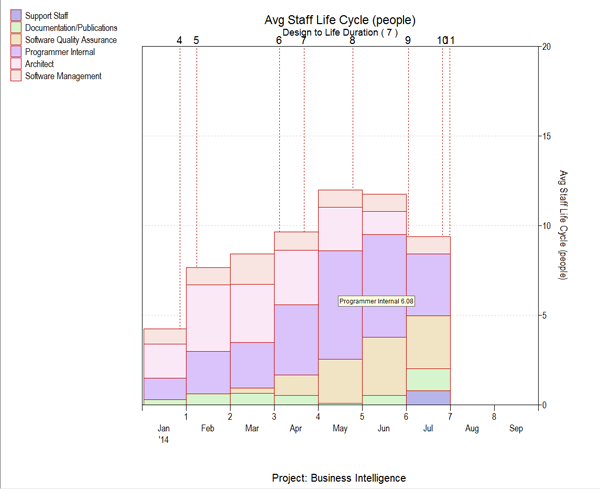
I am excited about the resource demand management capabilities in our newest SLIM-Estimate release (8.2). Software project estimates can now provide a breakout of Full Time Equivalent (FTE) staffing requirements by role by month. The staffing profile below shows how different roles, or skills, are required at different points in the schedule, based upon a particular development methodology. You can see that 6 FTE Programmers are needed by the month of May. Producing a high-level, scope-based estimate early in the software development lifecycle with detailed resource demand data helps the PMO and portfolio managers determine the best timing for project resource allocation, and setting project start dates that maximize productivity and reduce bottlenecks.

Software Resource Demand Management

Once the estimate and resulting project skills allocation plan has been approved, resource demand management has not ended. Tracking actual staffing at the skill and task level for in-flight projects not only ensures the right people are working on the right things, meaning that product development is on track, it also allows timely resource plan adjustments to address unforeseen staffing needs.

How to Use Big Data to Improve Your Software Projects

In the recent Washington Post article How the Obama Campaign Won the Race for Voter Data, Joel Kowsky writes about how the 2012 Obama campaign used analytics to improve their campaign strategy, and to ultimately secure the presidential victory.  

Regardless of where you stand on the political spectrum, it’s hard to argue that Barack Obama’s campaign strategy was anything short of impressive.  As soon as Obama took office in 2009, his team began preparing for his 2012 campaign.  From the start there was a strong emphasis on measuring the campaign’s progress.  Jim Messina, Obama’s 2012 campaign manager, stated 

“There’s always been two campaigns since the Internet was invented, the campaign online and the campaign on the doors.  What I wanted was, I didn’t care where you organized, what time you organized, how you organized, as long as I could track it, I can measure it, and I can encourage you to do more of it.”

The team began by conducting a postmortem study on their 2008 campaign where they analyzed the number of homes visited, phone calls placed, and voters registered by each field organizer and volunteer.  The result was a 500 page report which highlighted areas of improvement for the 2012 campaign.  

The suggestions led the Obama campaign to invest in building customized software that would integrate all the data the campaign had collected on voters, donors, and volunteers and link to individual voter profile.  This software analyzed previously collected data to calculate the likelihood of candidate support, the likelihood of election day turnout, and the degree of persuasion for each voter.  

Customizing SLIM Suite Workbooks

Although each workbook is set up with default themes, the look and feel of SLIM-Estimate, SLIM-Control, SLIM-Metrics, and SLIM-MasterPlan workbooks are readily customizable.  

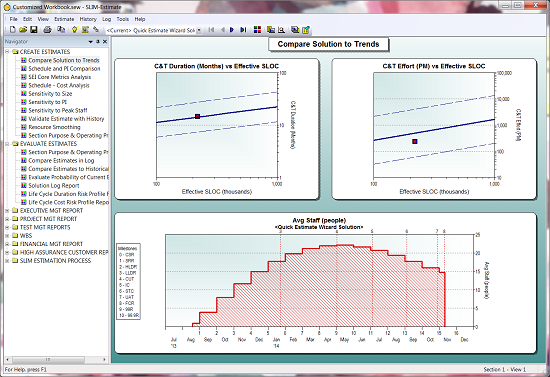
Default workbook settings

Screen Background

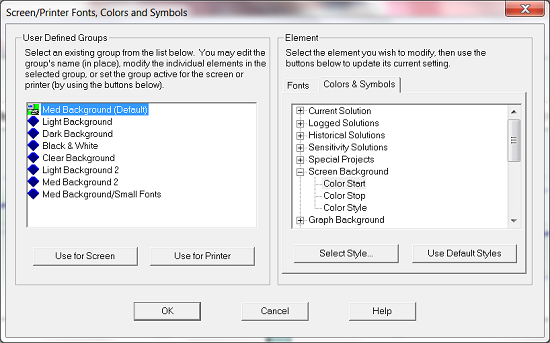
The easiest way to change the feel of your workbooks is to change the background color and style.  To change the background color, go to Tools|Customize Display|Screen/Printer Fonts, Colors, and Symbols…, then go to the Colors & Symbols tab on the right.

Screen/Printer Fonts, Colors, and Symbols

Color Start and Color End are important if you want to create a gradient background, like the background in the first image.  A gradient background begins with your specified Color Start color then transforms into your Color Stop color either vertically, horizontally, or diagonally (pictured above).  If you choose the Solid color style, simply select your Color Start.

Graph Background

Like the Screen Background, you can have a solid background or a gradient.  Simply follow the steps above for selecting your colors and styles.

Solutions and Reference Data

How Does Uncertainty Expressed in SLIM-Estimate Relate to Control Bounds in SLIM-Control? Part III

In the previous articles in this series I presented SLIM-Estimate’s use of uncertainty ranges for size and productivity to quantify project risk, and how to build an estimate that includes contingency amounts that cover your risk exposure.  In this post I will identify the project work plan reports and charts that help you manage the contingency reserve.  You will see how to use SLIM-Control bounds and default metrics to keep your project on track. 

Understand the project work plan documents.

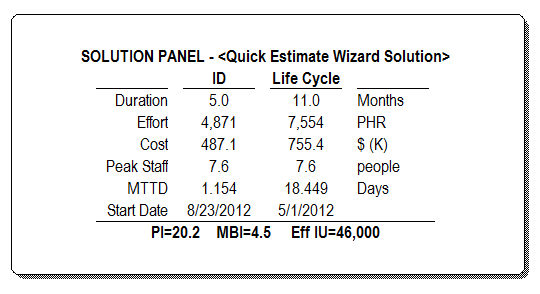
In our example so far, you have estimated a project to deliver a software product in 11.7 Months, with a budget of $988,223.  This estimate includes an 80% contingency reserve, or risk buffer, on both effort and duration.  Your work plan is based upon SLIM-Estimate’s 50% solution; 11 Months and $755,400.  Thus, the uncertainty about size and productivity are accounted for; it is built into your plan.  The probability that you will meet the project goals is driven by many factors ‒ too many to measure.  You can only manage what is within your control, and escalate issues so they can be resolved in a timely manner.

Managing the project well begins with a solid understanding of the detailed project plan.  SLIM-Estimate provides several default and customizable charts and reports that document the plan.  Here are a few key reports1 to study in order to identify the core metrics you will want to monitor closely.

Blog Post Categories 
SLIM-Control SLIM-Estimate

How does uncertainty expressed in SLIM-Estimate relate to Control Bounds in SLIM-Control? Part II

Several months ago, I presented SLIM-Estimate’s use of uncertainty ranges for size and productivity to quantify project risk.  Estimating these two parameters using low, most likely, and high values predicts the most probable effort and time required to complete the project.  This post shows you how to use SLIM-Estimate’s probability curves to select the estimate solution and associated work plan that includes contingency amounts appropriate to your risk.

Begin with an unconstrained solution

The default solution method used for new estimates, whether you are using the Detailed Method or another solution option, is what we call an unconstrained solution.  Just as it sounds, no limits have been placed on the effort, schedule, or staffing SLIM-Estimate can predict.  It will calculate the resources required to build your product (size) with the capabilities of your team (PI).  Assuming you have configured SLIM-Estimate to model your life cycle and based your inputs on historical data, you have produced a reasonable, defensible estimate.  

Solution Panel

Blog Post Categories 
SLIM-Control SLIM-Estimate

Agile Series Part 3: Embrace Change

“The only thing that is constant is change” ~Heraclitus

This proverb is often told to individuals (like me) who love to see a project follow a plan from start to finish.  I’ll be honest, I’m a planner. I’m thrilled when the plans I put in motion actually work out the way I intended.  These are the moments when I retort, “the only people who like change are wet babies.” However, more often than not, something changes, which throws off my entire plan and forces me to not only revisit Heraclitus’s proverb but also rethink my plan entirely.

Building software, particularly in Agile development, is no exception. In fact, the second principle of the Agile Manifesto states that developers should: “Welcom[e] changing requirements, even late in development. Agile processes harness change for the customer’s competitive advantage.”

It would seem, then, that this principle would disappoint any planner working on an Agile team. Why bother creating a development plan if you know the stakeholders are going to change their minds about their desired features at the last minute? While we’re on this subject, if the requirements are going to change from one iteration to the next, why bother estimating the project at all?

Blog Post Categories 
SLIM-Control Agile

Creating an Effective Project Closure Checklist

After one particularly difficult midterm in college, my professor said, "This is just a wakeup call; there's still time to improve before the final." I think that wakeup call was particularly painful, but my professor's words stick with me today, especially when thinking about data collection (or lack thereof) when a project is over.

As someone who is not a project manager, it was difficult for me to understand why project managers would not collect their own historical data. I understand now that after a project is finished, people move on to the next project and there's no time to update project stats. Recently, I read a post on Gantthead.com by Kenneth Darter called, Project Closure: Party or Post-Mortem?. Darter says if the project was a success, then it's important to record why it was successful; if the project was not successful, it's important to capture why it was not successful.

The word "data" in Latin literally means "things having been given." At the end of a project, you have been given a lot of things that only you and your team know: size, effort, duration, staffing, PI, cost, etc. If you are able to take a moment to fully document your project information, you not only build a historical database, but you're able to reflect back on that project to improve future endeavors (whether you would like to remember it or forget it completely). Darter recommends creating a checklist which, "should be defined early on in the project and communicated to everyone who will have input into the checklist at the end of the project." In addition to project specific information, he specifically recommends these three items:

Blog Post Categories 
SLIM-Control Data

How do the uncertainty ranges in SLIM-Estimate relate to Control Bounds in SLIM-Control?

I am often asked this question during SLIM Training classes.  I remember wondering about that myself.  It is a logical question since SLIM-Estimate workbooks are often imported into SLIM-Control to create the baseline project plan.  The answer is ‐‐ they are not directly related, because uncertainty ranges, probability curves, and control bounds are designed to perform different tasks.  This post is the first in a series looking at risk associated with an estimate, risk of your project plan, and handling deviations from the plan.

What are we talking about?

The first thing we need to do is define some very important terms that are often misused (I am the first to admit I have been guilty!).  I went to good old Dictionary.com and looked up the following:

Blog Post Categories 
Risk Management SLIM-Control SLIM-Estimate

What If? The Power of the Question

After being away from QSM and the software world for three years, I was blown away by SLIM v8.0's dynamic product integration. I knew it was coming, yet I was still impressed by the simplicity and power of analysis promoted by real-time data and tool links across the SLIM Suite that frees managers to focus on the important program issues.

SLIM-MasterPlan is the center of the SLIM Suite product integration.  It improves upon previously existing program management features of aggregating multiple SLIM-Estimate projects and ancillary tasks with two new capabilities: 

  • Linking SLIM-Control workbooks to provide real-time project tracking and control at the program level 
  • Performing What If analysis at this higher management view to consider a wider range of potential outcomes.

The What If analysis feature is what I want to highlight.

A good personal development coach knows the "power of the question."  Questions lead to discovery, innovation, and action that brings about positive change.  Better questions lead to better answers.  SLIM's power and distinction has always been fast and easy evaluation of the impact of change, and exploring the realm of possible outcomes.  That's what we are doing when we ask ourselves "What If…?" (or our boss asks us - and we better know the answer!).  SLIM's solution logs make it easy to compare estimates, plans, and forecasts to alternative solutions, QSM trends, and your historical project database.