Updated Performance Benchmark Table
The latest version of QSM’s Performance Benchmark Table is live!
QSM is excited to announce the release of their latest version of the Performance Benchmark Table. Last updated in 2009, the table provides a high-level reference for benchmarking and estimating IT, Engineering, and Real Time Systems. It displays industry average duration, effort, staff, and SLOC (or FP) per Person Month for the full range of project sizes encompassed by each trend group.
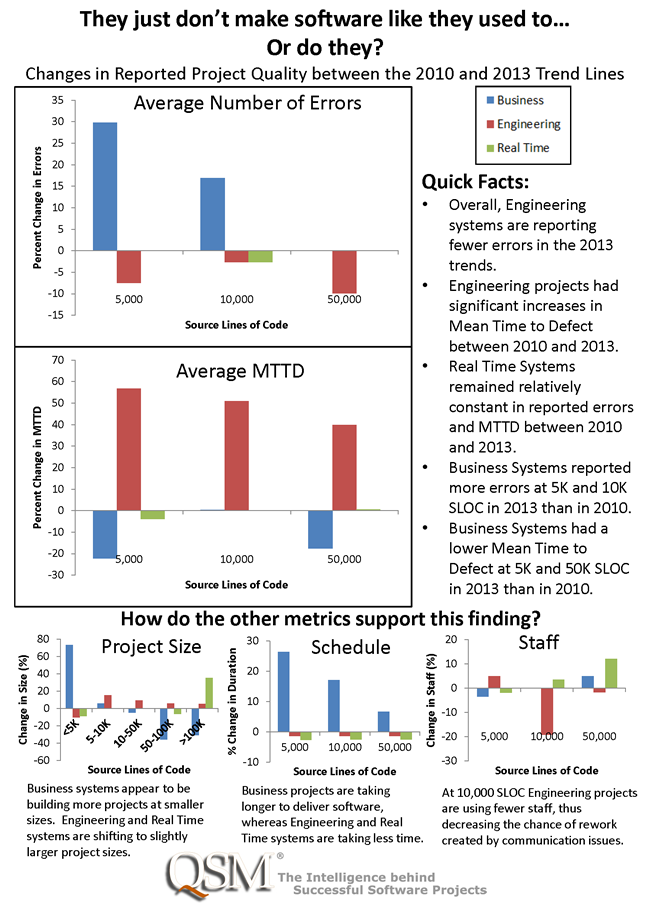
The results were analyzed from a database of 1,115 high or moderate confidence projects completed between 2008 and 2012. Sixteen countries and 52 different languages were represented in this sample. In addition to the industry average, minimum and maximum values were also provided for each metric to help give a range of possible results.
The project sizes differed somewhat from the previous version to accommodate the new range of sizes present in the data. Rather than using the same project sizes across trend groups, we selected project sizes specific to each trend. Since Business projects are typically smaller than Engineering or Real Time projects, this allows readers to select a size relevant to the type of project they’re estimating or benchmarking.
This tool can be particularly useful to developers and/ or project managers who are new to estimation or do not have historical project data.


