Data

Data

How to Use Big Data to Improve Your Software Projects

In the recent Washington Post article How the Obama Campaign Won the Race for Voter Data, Joel Kowsky writes about how the 2012 Obama campaign used analytics to improve their campaign strategy, and to ultimately secure the presidential victory.  

Regardless of where you stand on the political spectrum, it’s hard to argue that Barack Obama’s campaign strategy was anything short of impressive.  As soon as Obama took office in 2009, his team began preparing for his 2012 campaign.  From the start there was a strong emphasis on measuring the campaign’s progress.  Jim Messina, Obama’s 2012 campaign manager, stated 

“There’s always been two campaigns since the Internet was invented, the campaign online and the campaign on the doors.  What I wanted was, I didn’t care where you organized, what time you organized, how you organized, as long as I could track it, I can measure it, and I can encourage you to do more of it.”

The team began by conducting a postmortem study on their 2008 campaign where they analyzed the number of homes visited, phone calls placed, and voters registered by each field organizer and volunteer.  The result was a 500 page report which highlighted areas of improvement for the 2012 campaign.  

The suggestions led the Obama campaign to invest in building customized software that would integrate all the data the campaign had collected on voters, donors, and volunteers and link to individual voter profile.  This software analyzed previously collected data to calculate the likelihood of candidate support, the likelihood of election day turnout, and the degree of persuasion for each voter.  

Database Validation Best Practices

Database validation is an important step in ensuring that you have quality data in your historical database.  I've talked before about the importance of collecting project data and what you can do with your own data, but it all hinges on having thoroughly vetted project history.

Although it's nice to have every tab in SLIM-DataManager filled out, we really only need three key pieces of information to calculate PI:

  • Size (Function Unit): if the function unit is not SLOC, a gearing factor should be provided (97.3% of projects in the database report total size)
  • Phase 3 duration or start and end dates (99.9% of projects in the database report phase 3 duration)
  • Phase 3 effort (99.9% of projects in the database report phase 3 effort)

These fields can be thought of as the desired minimum information needed, but even if one is missing, you may not want to delete the project from the database. A project that is missing effort data, for instance, will not have a PI but could be used to query a subset of projects for average duration by size. Likewise, a project with no size will not have a PI, but does contain effort and duration information that could be useful for calculating the average time to market for a division. However, if possible, it is a good idea to fill out at least these three fields.

Blog Post Categories 
SLIM-Metrics Data SLIM-DataManager Database

New Article: Data-Driven Estimation, Management Lead to High Quality

Software projects devote enormous amounts of time and money to quality assurance. It's a difficult task, considering most QA work is remedial in nature - it can correct problems that arise long before the requirements are complete or the first line of code has been written, but has little chance of preventing defects from being created in the first place. By the time the first bugs are discovered, many projects are already locked into a fixed scope, staffing, and schedule that do not account for the complex and nonlinear relationships between size, effort, and defects. 

At this point, these projects are doomed to fail, but disasters like these can be avoided. When armed with the right information, managers can graphically demonstrate the tradeoffs between time to market, cost, and quality, and negotiate achievable deadlines and budgets that reflect their management goals. 

Leveraging historical data from the QSM Database, QSM Research Director Kate Armel equips professionals with a replicable, data-driven framework for future project decision-making in an article recently published in Software Quality Professional

Read the full article here.

Blog Post Categories 
Articles Data Quality

What's the Story in Your Data?

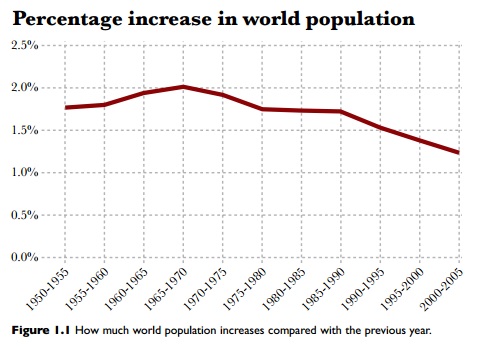
In his book, The Functional Art, Alberto Cairo sets out to explain what data visualizations are, why it is significant to pair data and design, and how to assess whether a data visualization is "good" or not.  In the first chapter, Cairo presents an example from Matt Ridley's book, The Rational Optimist: How Prosperity Evolves.  Ridley asserted that the global population was decreasing over time, using only one line chart.

Percentage Increase in World Population


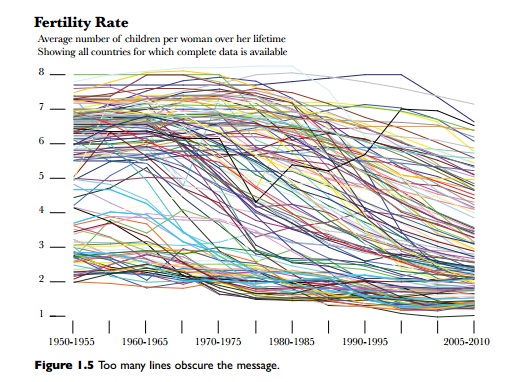
Cairo  was uncomfortable with that assertion, so he used the UN and World Bank data for fertility rates (the average number of children born to a women in each country) to create a graph that used individual country population data instead of using aggregate data.  The chart below shows all the fertility rates for every country over time.

Fertility Rate

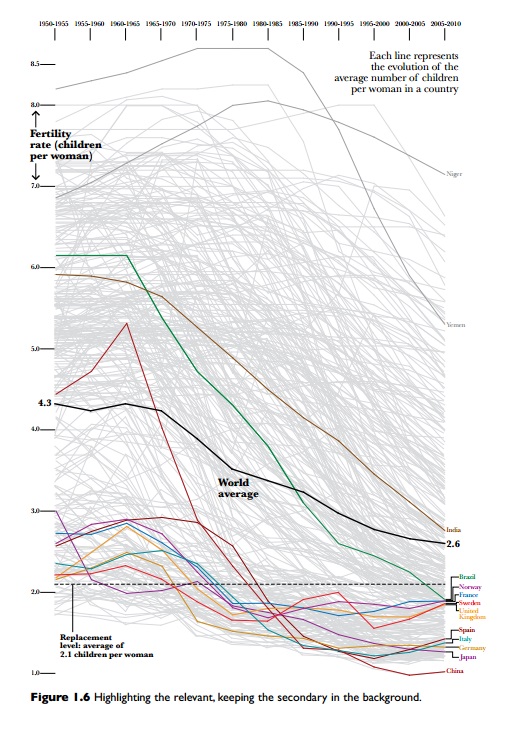
There are so many stories in the data that it's overwhelming, so Cairo created the following graphic which highlights just a few countries in order to pull out the story within the data:

Figure 1.6 Highlighting the relevant, keeping the secondary in the background

Blog Post Categories 
SLIM-Metrics Data

Data Myths

In a post for The Guardian's Datablog, Jonathan Grey explores the rise of data journalism. Data journalism is "a journalistic process based on analyzing and filtering large data sets for the purpose of creating a new story. Data-driven journalism deals with open data that is freely available online and analyzed with open source tools. 

Although data is a powerful tool, Grey reminds readers that it's not a silver bullet and counters some commonly held data myths. 

Data is not a perfect reflection of the world.

Blog Post Categories 
SLIM-Metrics Data SLIM-DataManager

Taking Responsibility for Quality Data

Thomas C. Redman recently wrote about data quality on the Harvard Business Review blog.  In his post, he creates a vignette of an executive who finds an error in data provided by the "Widgets Department" for an important meeting. The executive corrects the error, the meeting is a huge success, and the story ends there. Redman argues that someone should have gone back to the Widgets Department to report the error, not to complain that the error could have ruined the presentation, but rather that it could ruin the next person's presentation.

The hardest part about database validation is not reviewing every individual project, but rather, determining if the information on each tab is correct. Sometimes, it's easy to tell that the organization name is spelled incorrectly, other times, it's difficult to discern if a labor rate is incorrect. Having a well-documented database is important, not just for your own use, but for whatever you plan on using it for next.  For example, if you plan on making custom trend lines, but you recorded that it took you 31 man months instead of 3.1 man months, that would have a disastrous effect on your trends! It's obvious that the error would need to be recorded, but it's also important to report the error to whoever prepared the data so that they can check the rest of the projects in the database for the same error. 

Redman suggests creating an office culture which promotes the following three points:

Blog Post Categories 
Data SLIM-DataManager

Data is the New Soil

David McCandless gave a TED talk  in July 2010 that focused on pairing data and design to help visualize patterns.  In his talk, McCandless takes subsets of data (Facebook status updates, spending, global media panic, etc.) and creates diagrams which expose interesting patterns and trends that you wouldn't think would exist.  Although the focus of McCandless' talk was about how to effectively use design to present complex information in a simple way, I was struck by his own claim that data is not the new oil, but rather that data is the new soil.  For QSM, this is certainly true!

QSM maintains a database of over 10,000 projects with which we are able to grow a jungle of ideas, from trend lines to queries about which programming languages result in the highest PIs.  With  the amount of soil that we have, we are able to provide insight into the world of software, just with the data that is graciously provided by our clients.  By collecting your own historical data in SLIM-DataManager, you can create your own trend lines in SLIM-Metrics to use in SLIM-Estimate and SLIM-Control, analyze your own data in SLIM-Metrics, tune your defect category percentages and calculate your own PI based on experience in SLIM-Estimate, and much, much more. 

Creating an Effective Project Closure Checklist

After one particularly difficult midterm in college, my professor said, "This is just a wakeup call; there's still time to improve before the final." I think that wakeup call was particularly painful, but my professor's words stick with me today, especially when thinking about data collection (or lack thereof) when a project is over.

As someone who is not a project manager, it was difficult for me to understand why project managers would not collect their own historical data. I understand now that after a project is finished, people move on to the next project and there's no time to update project stats. Recently, I read a post on Gantthead.com by Kenneth Darter called, Project Closure: Party or Post-Mortem?. Darter says if the project was a success, then it's important to record why it was successful; if the project was not successful, it's important to capture why it was not successful.

The word "data" in Latin literally means "things having been given." At the end of a project, you have been given a lot of things that only you and your team know: size, effort, duration, staffing, PI, cost, etc. If you are able to take a moment to fully document your project information, you not only build a historical database, but you're able to reflect back on that project to improve future endeavors (whether you would like to remember it or forget it completely). Darter recommends creating a checklist which, "should be defined early on in the project and communicated to everyone who will have input into the checklist at the end of the project." In addition to project specific information, he specifically recommends these three items:

Blog Post Categories 
SLIM-Control Data

Demand the (Right) Right Data with SLIM-DataManager

A few weeks ago, Thomas C. Redman posted Demand the (Right) Right Data on the Harvard Business Review blog, about how managers should set the bar higher, in terms of data.

Why are managers so tolerant of poor quality data? One important reason, it seems to me, is that most managers simply don't know that they can expect better!  They've dealt with bad data their entire careers and come to accept that checking and rechecking the "facts," fixing errors, and accommodating the uncertainties that using data one doesn't fully trust are the manager's lot in life.

Although Redman suggests that managers should demand higher quality data, I immediately thought about how to check the quality of SLIM-DataManager databases using the Validate function and SLIM-Metrics.

If you're using SLIM-DataManager to create your own historical database, you can use the Validation feature to help you demand the (right) right data.  The Validation feature in SLIM-DataManager analyzes the projects in your database, highlights suspect projects, and offers a brief explanation tool tip.  Simply go to File|Maintenance|Validate to run this feature and wait for SLIM-DataManager to analyze your database.  If SLIM-DataManager detects anomalies, it will highlight that project in blue.  If you hover over that project, a tooltip will explain what is wrong with that project data and what you need to take a second look at.