Estimation

Estimation

The Balancing Point between Project Cost and Schedule

In all production environments, there exists a tension between competing outcomes.  Four variables come to mind:

  • Cost/Effort
  • Schedule
  • Quality
  • Productivity

These do not exist independently of one another.  Emphasizing any one impacts the others.  For example, to compress a project’s schedule, additional staff is typically added which increases the cost.  Larger team size also increases communication complexity within a project which leads to more defects (lower quality).  The development of software  presents a unique issue that may not be present or is at least more muted in manufacturing:  non-linearity.  Key examples of this are the relationships between cost/effort and schedule and the one between schedule and quality. 

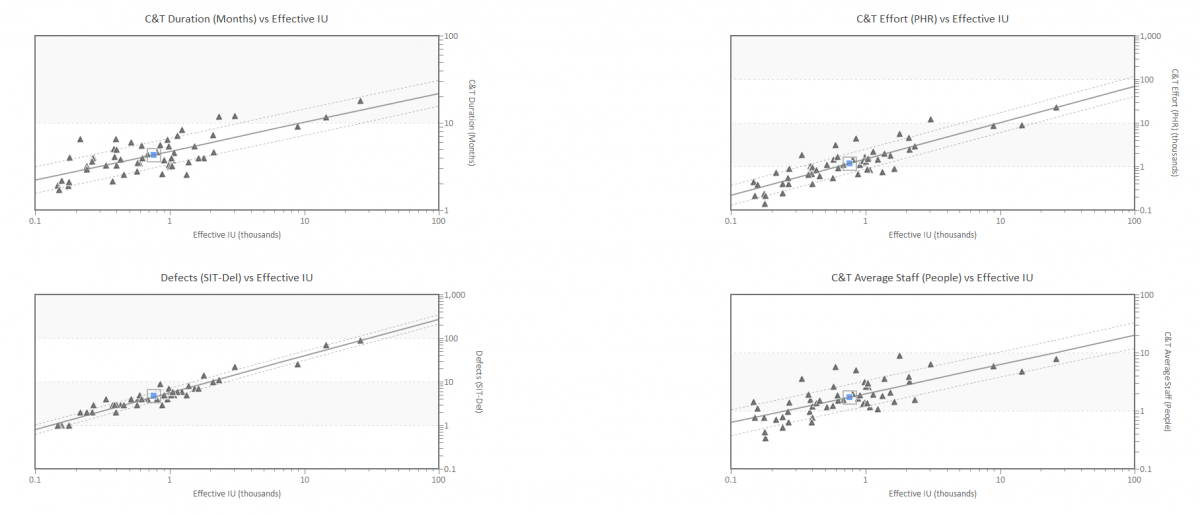
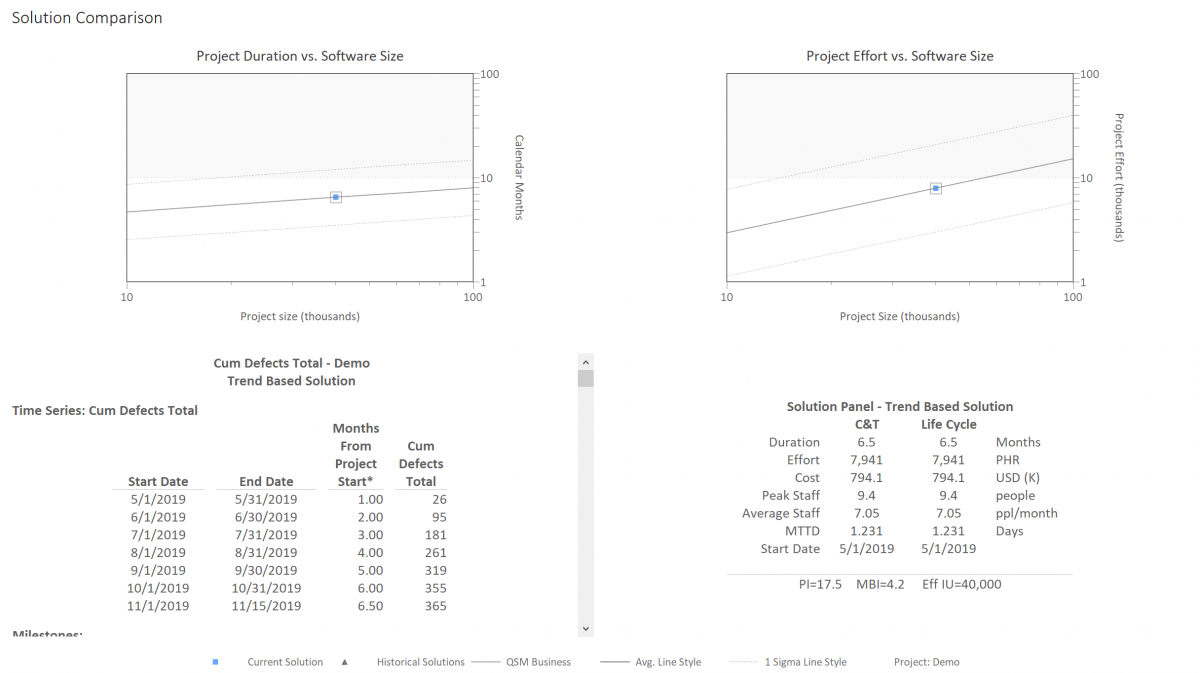
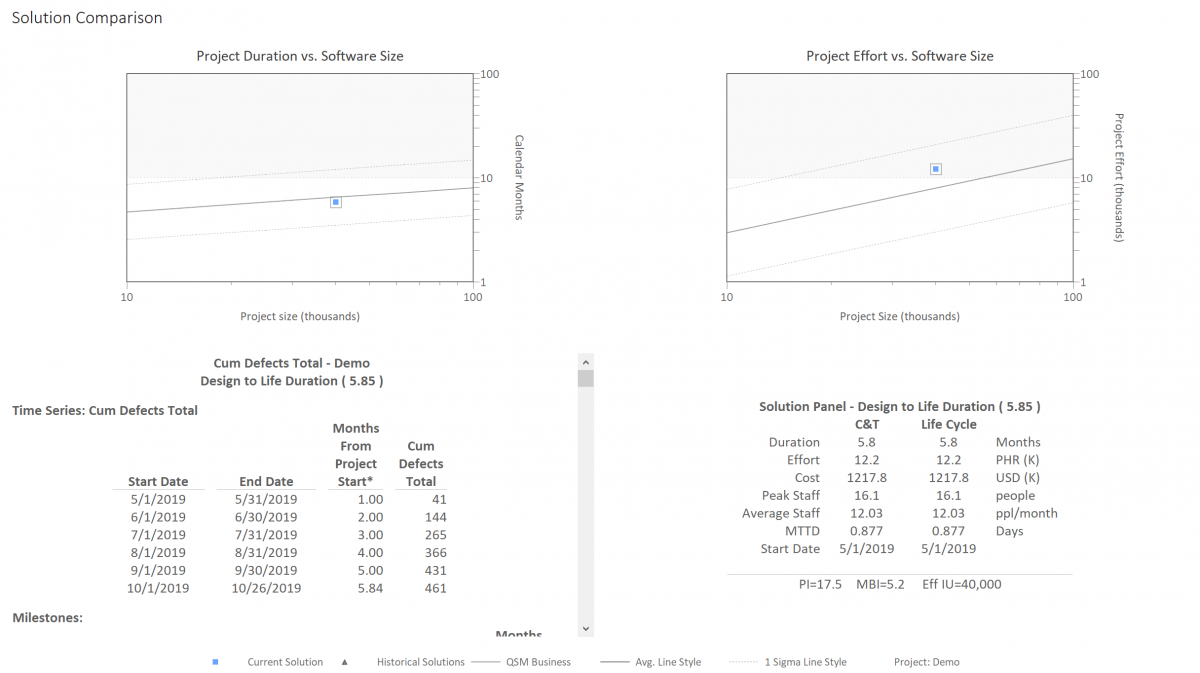
Let’s look at some examples.  In the charts below, regression trend lines for schedule and effort vs. size were developed from the QSM software project database.  The darker center lines represent average schedule and effort outcomes as delivered product size grows.  The lighter lines are plus and minus 1 standard deviation.  Roughly 2/3 of the projects in the database fall between the standard deviation lines.  Note the scale on the axes, which is log-log.  This is because the relationship between the amount of software developed and schedule duration or effort is non-linear. 

Software Project Solution
6.5 Month Solution

Software Project Solution
5.85 Month Solution

Blog Post Categories 
Estimation Schedule Effort

Can Estimation & Analytics Improve Vendor Client Relations?

It happens time and time again. Clients look to their vendors to provide software development or configuration services and both sides are often left with big questions. Is the price fair? Can we really get the project done within our duration and resource goals? How can we negotiate for a successful outcome?

There are estimation solutions available that can help. The good ones will leverage empirically-based models, historical data, and industry analytics to uncover which proposals are feasible and which ones are risky.

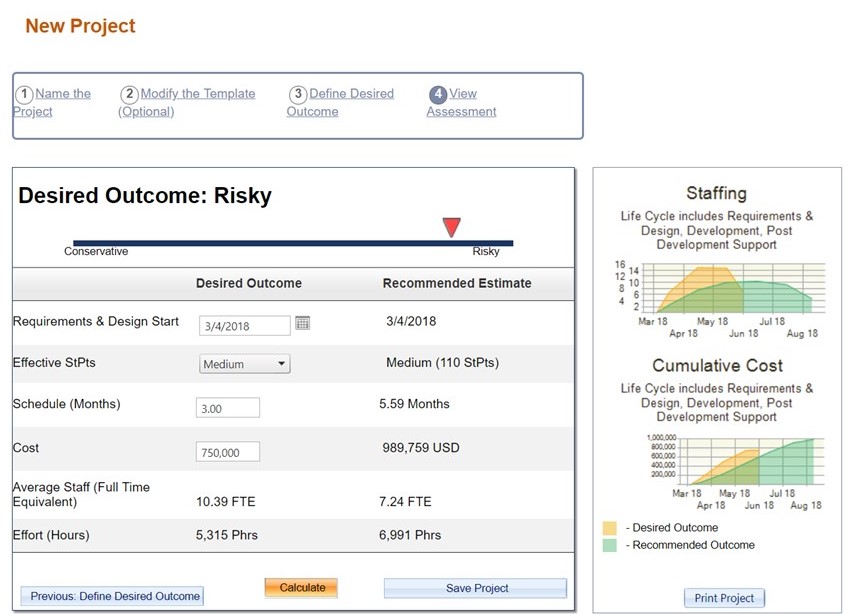
In the first view below, there are two columns: the “Desired Outcome,” which is one vendor’s proposal and the second column, which is the data-driven “Recommended Estimate.”  The vendor is promising to complete the work in 3 months with a $750,000 price tag. You can see that this proposal is “Risky” and that the vendor will probably finish late and will either have to ask for more money or lose money in the long run.  The charts in the view provide a graphical representation.

Vendor Bid

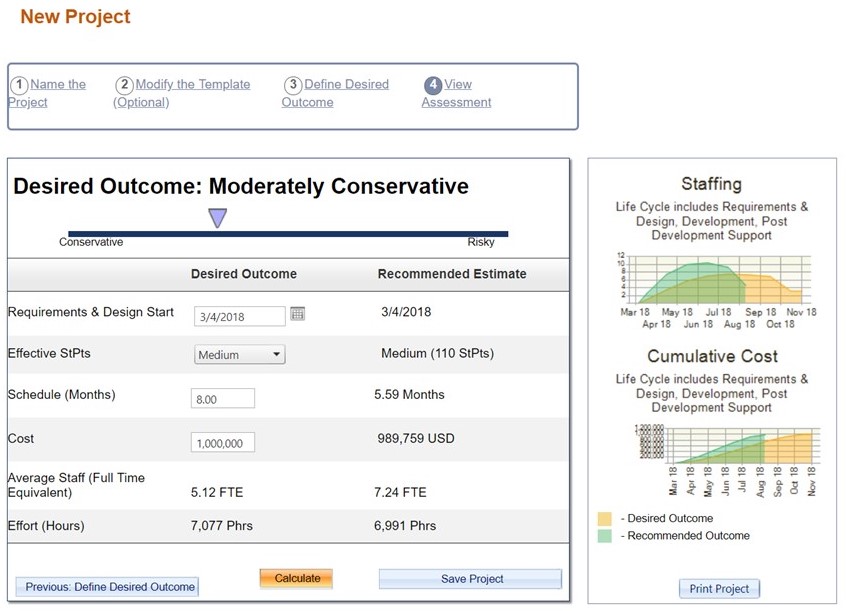
In the second view for the same project, you see a second vendor’s proposal compared to the “Recommended Estimate.” The vendor’s bid is for 8 months with a $1,000,000 price tag and there is a “Moderately Conservative” rating. In other words, this vendor has a much better chance of achieving what they are promising. 

Vendor Bid

Blog Post Categories 
Vendor Management Estimation

Are Your Software Projects Too Small?

We hear a lot about software projects that are too large or attempt to do too much in too short of a time.  They are very visible and negatively impact both budgets and careers in a not positive manner when they fail.  Small projects may fly under the radar.  This is a mistake.  Most IT projects aren’t large undertakings like Healthcare.gov; rather, they are enhancements and customizations to already existing software systems and account for the majority of most enterprises’ software budget.  Planning these projects to be optimally productive is an area in which most companies can realize the greatest returns.

How do you know what is the optimal amount of software to develop in a project?  In a newly published software benchmark study QSM analyzed productivity, cost/effort, and time to market of a large sample (over 600) of business IT projects that have recently completed.  The projects were divided into quartiles based on the amount of software they developed or customized, which were then compared to each other.  Fully ¼ of the projects were smaller than 3,200 implementation units in size or 68 function points for projects that used that size measure.  Projects in this quartile had a median productivity of 200 IU per staff month or 5 function points per staff month.  The median duration of these projects was slightly more than 3 months. The second quartile contained projects from 3,200 IU up to 8,000 (or 69 to 149 function points).  These projects had a median productivity of 377 IU per staff month (or 7.62 function point per staff month) and lasted a little more than 5 months.  This is a productivity improvement of 89%.  The smaller projects were markedly less productive.  So, simply by bundling software work into larger packages there are significant efficiencies to be gained.

Blog Post Categories 
Estimation Sizing Productivity

Microsoft Services Global Apps CTO Discusses His Team's Evolution Around Estimation

As the Apps Global CTO for Microsoft Services, Lenny Fenster sees the need for estimation in many shapes and sizes throughout the world. In his twenty years at Microsoft, Lenny has also seen many different attempts to improve how Microsoft Services estimates time and effort for software development projects. Not all of them have hit the mark. In this presentation for the QSM 2018 Virtual Conference, Lenny talks about the evolution his team is driving in Microsoft Services to improve the maturity, consistency, and defensibility of software estimation for some of the largest and most complex software projects in the world. He talks specifically about the intentional separation of scope and estimation and the use of SLIM as a key ingredient in the success they are now having. Estimates are now done much quicker, reducing the time to run an estimate from days to just 4.5 hours.  

Lenny was gracious enough to answer questions throughout his presentation about the estimation process at Microsoft Services. This sparked great participation from our audience, who asked a number of questions worth resharing. Here are the highlights:

Q: Did you experience any resistance among the architects in changing the way they did estimation to a new approach?­

Blog Post Categories 
Estimation Webinars

Is Software Estimation Needed When the Cost and Schedule Are Fixed?

In many agile environments, the budget, team size, and schedule are fixed based on an organization’s predetermined targets for sprints or iterations. This leads many project managers to question if software estimation is even necessary. The problem is, without a reliable size estimate, the amount of functionality promised within the time and money constraints could be difficult to achieve and could cause the product delivery to be short on features, or late and over budget.

This is where scope-level estimation tools come into play. They can help evaluate whether targets are reasonable and, even if the schedule and budget are both set in stone, they can help figure out how much work can be delivered. This type of analysis helps set customer expectations and provides data driven leverage for negotiations.

The best estimation tools leverage empirically-based models, industry analytics, and historical data. They can even be used before iteration level planning takes place. They ensure that the overall goals are reasonable before detailed plans are developed. 

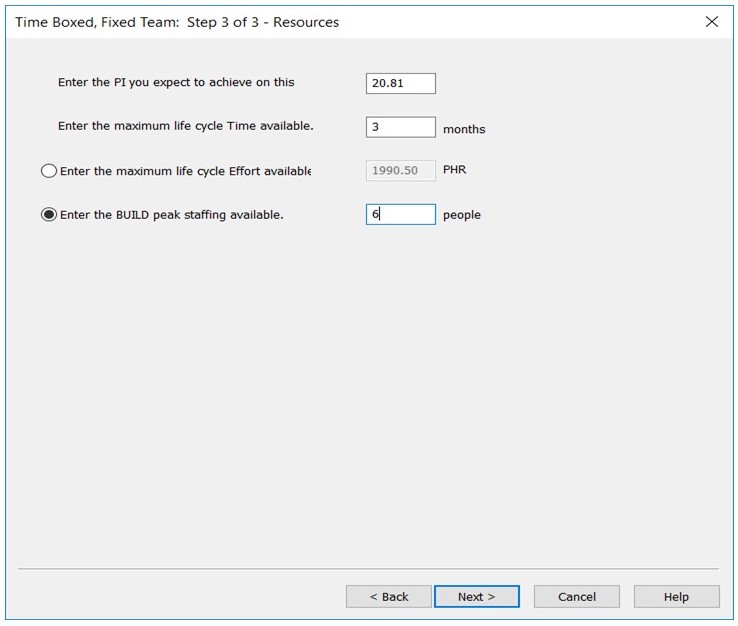
In the three views below, we see an estimate generated from a “Time Boxed” method. This is where the product manager was able to input the predetermined time, a productivity measure (PI), and a team size, to see how many story points could be completed within the set constraints. The analysis also includes a “sanity check” of the estimate, comparing it to an agile industry trend from the QSM Industry Database and their own agile historical data.

Time Box

Time Box

Blog Post Categories 
Agile Estimation

Bringing Transparency into Project Contingency Buffers for Schedule and Cost

The application of contingency buffer, more commonly known as “padding” or “management reserve” is the final step in any project estimation process.  The most common practice is for the estimator to use an intuitive multiplier which is added to base estimate.  Unfortunately, everyone has a different multiplier which is shaped by their own personal bias about risk and it is hidden in their head.  This creates a fundamental problem with transparency and consistency within most organizations.

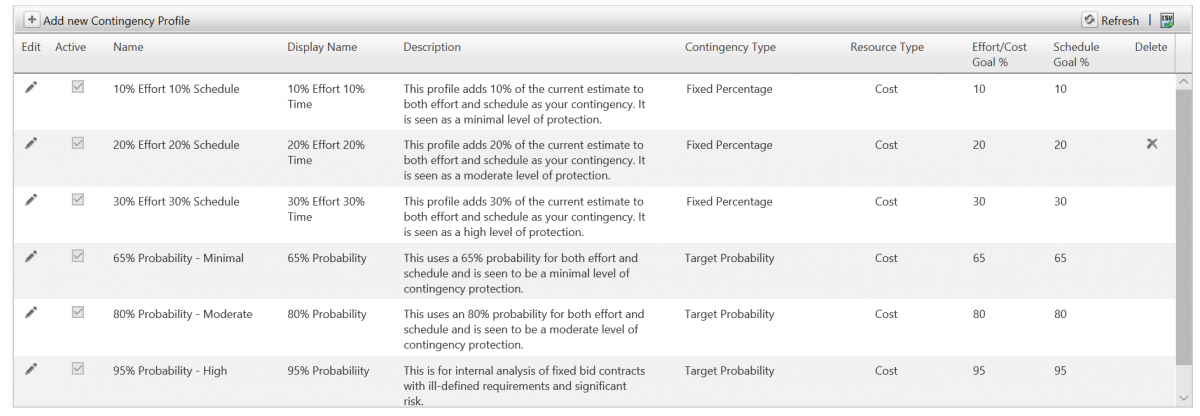
Fortunately, there's a better way.  One solution is to define and configure agreed upon standards that are matched to specific business risk situations.  These should be collaboratively agreed to by all the stake holders in the organization.  Then they can be codified into a configuration that can be selected at the time when contingencies are typically applied to an estimate.  This helps solve the consistency issue.

Project Risk Buffer

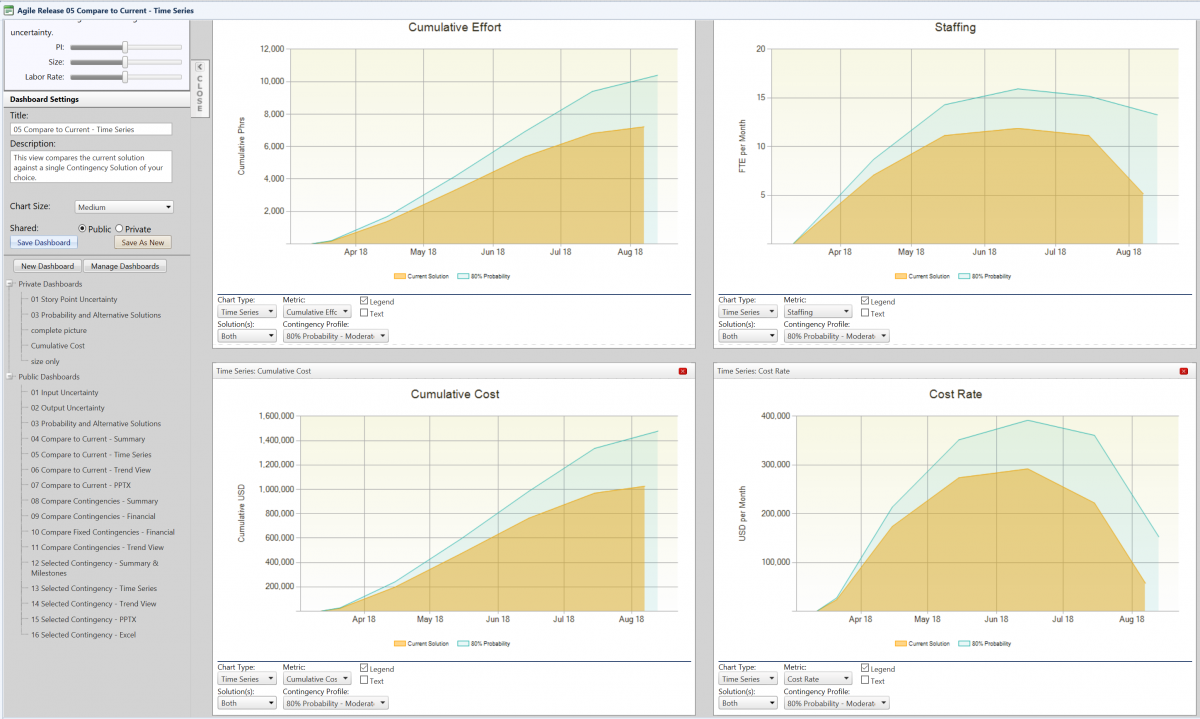
To attack the transparency issue, you can use a technique of overlays to visualize the contingency in comparison to the base estimate. 

Project Risk Buffer

Estimating Program Increment Capacity in Scaled Agile (SAFe)

Scaled Agile (SAFe) is a methodology that applies Agile concepts to large complex environments.  QSM recently worked with an organization that had implemented SAFe to develop an estimation methodology specifically tailored to it.  This article discusses how it was implemented.

Software estimation typically addresses three concerns: staffing, cost/effort, and schedule.  In the SAFe environment, however, development is done in program increments (PI) that in this case were three months in duration with two-week sprints throughout.  Staffing was set at a predetermined level and varied very little during the PI.  Thus, the three variable elements that are normally estimated (staff, cost/effort, and schedule) had already been determined in advance.  So, our job was done, right?  Wrong!  What remained to be determined was capacity: the amount to be accomplished in a single PI.  And that was a very sore “pain point” for the organization. 

Blog Post Categories 
Agile Estimation Capacity Planning

Using Business Analytics to Set Realistic Customer Expectations

I was recently reading an article by Moira Alexander titled “Why Planning Is the Most Critical Step in Project Management” and I was stuck by her observation that one of the primary reasons that projects fail is because they commit to unrealistic expectations.  In my 35 years of experience, I believe this is the number one reason projects fail.  Yet it is competence that few organizations or product owners ever get good at.

 Today there are good simulation tools that make it simple to establish realistic project boundaries.  The results can be used effectively to communicate and negotiate expectations with clients.  

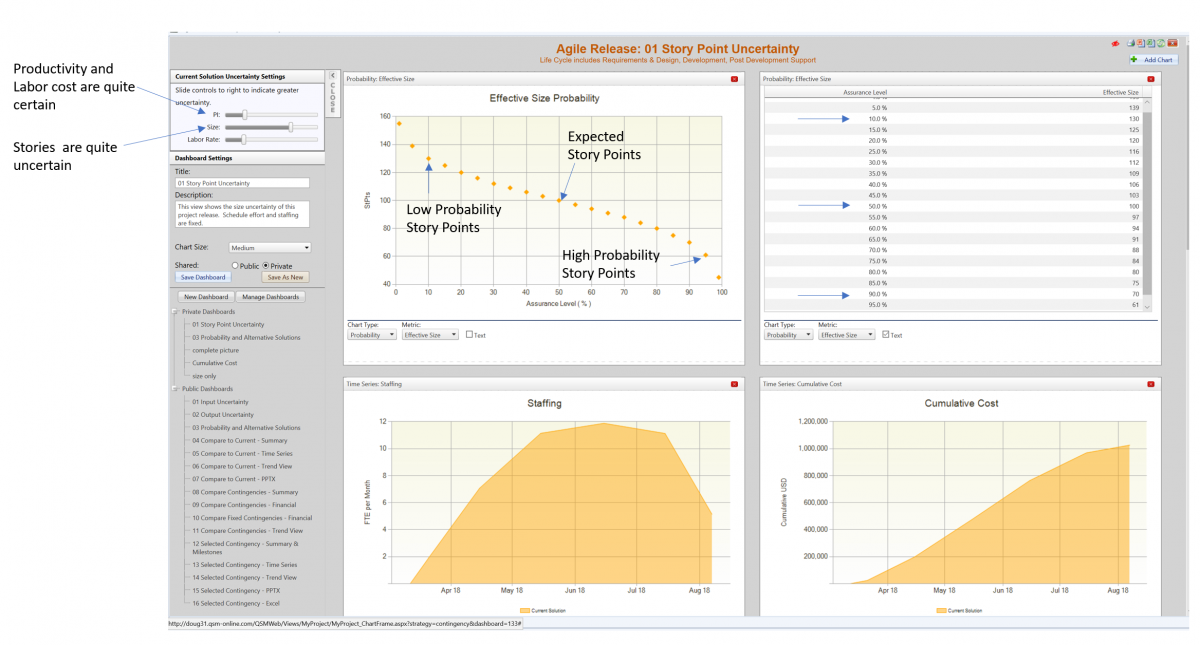
For example, imagine that you are a product owner planning out your next release.  Your team of 10 people has been working on a 5-month release cadence.   A backlog refinement has shown that there are approximately 100 story points to be completed in this release.  The project plan is shown in the figure below.

Agile Uncertainty

However, there are some uncertainties and we need to deal with them in a realistic way.  Since the schedule and the team size are fixed, the only area that can give is the functionality.   Simulations are a great way to quantify uncertainty.  In our case, we are confident in our team’s productivity and labor cost, but we are somewhat more uncertain about the new capabilities in this release.   It is easy to adjust the uncertainty settings and run a business simulation.  The uncertainty slider bars are in the image below. 

Blog Post Categories 
Estimation Risk Management

Estimation Is Good. Tracking and Oversight Are Even Better!

Now that the baseline estimate has been created, and stakeholders feel their inputs and concerns have been addressed, we as purveyors of the estimate have done our job.  In the world of IT project measurement, many organizations will deservedly feel accomplished that they have armed their development staff with an empirically based roadmap from which to navigate the next x number of months toward delivering a product.  Now let the construction and testing begin!  But wait, there’s more!

It’s always wise to have a sound estimate, but for added assurance of hitting the budget, schedule, staffing and risk targets, organizations have the option of tracking the project mid-flight. Just as estimating is conflated with planning, tracking can be equally confused with other one-dimensional monitoring of projects underway.  So many things can change from the time an estimate is created to the time the first iterations are built.  It’s likely that our estimate assumptions will change after some time has passed into the construction process, unless we have reacted to inevitable unforeseen forces.  For example, requirement changes, staff turnover, management demanding the project x weeks/months earlier, but still expecting all the original functionality.  These are all very real events that are thrown at the PM after the project is underway.  We at QSM have provided a solution for this since the mid-80’s in SLIM-Control, a module in our SLIM Suite.

Software Project Tracking

Blog Post Categories 
SLIM-Control Estimation

10 Tips for Better Software Estimation

This year, QSM will be celebrating our 40th anniversary! Over the years, we have helped many project managers figure out what their software projects should cost, how long they should take, and how to mitigate project and portfolio risk.  Here are 10 tips that every organization should remember for effective software estimation.
  1. Capture some historical data on your projects and keep it simple. The more data, the better, but you can get a good start to your estimation program with just a few projects and a small amount of data from each of those projects. Focus on the core metrics: size, duration, reliability, productivity, and effort. 
  2. Estimate at the release level before detailed planning takes place. This will enable you to tailor your detailed plan to goals that are reasonable. Many analysts spend hours laying out detailed plans for projects that end up over budget and late because they don’t figure out the big picture first. 
  3. Use an empirically-based model that enables you to manage uncertainty. When making big decisions, it’s important to see the 90% chance compared to the 50%. 
  4. Sanity-check your estimates with industry analytics. It’s always good to see typical cost and duration trends from projects that are similar to yours. 
Blog Post Categories 
Estimation