Tips & Tricks

Tips & Tricks

Does Your Estimate Accurately Reflect the Five Dimensions of Software Trade-offs?

A recent series of posts by Karl Wiegers eloquently discusses the "reality of tradeoffs" software professionals deal with every day, going beyond the typical success drivers (time, cost, and quality) to include product features and staff. He shares inspiring practical information by making distinctions between constraints, drivers, and degrees of freedom, each representing the amount of flexibility the project manager has to adjust a key factor.

SLIM-Estimate has modeled the non-linear interdependencies of these metrics for over thirty years. It accounts for Wiegers’s five project success factors explicitly, showing the tradeoffs between them in real time. I have mapped Wiegers’s Five Dimensions to SLIM-Estimate’s parameters to show how you can use SLIM-Estimate quantify the trade-offs Wiegers describes.

Blog Post Categories 
Estimation Tips & Tricks

Improve Your Project Comparisons

Here is a helpful tip for comparing project performance for projects of different sizes.

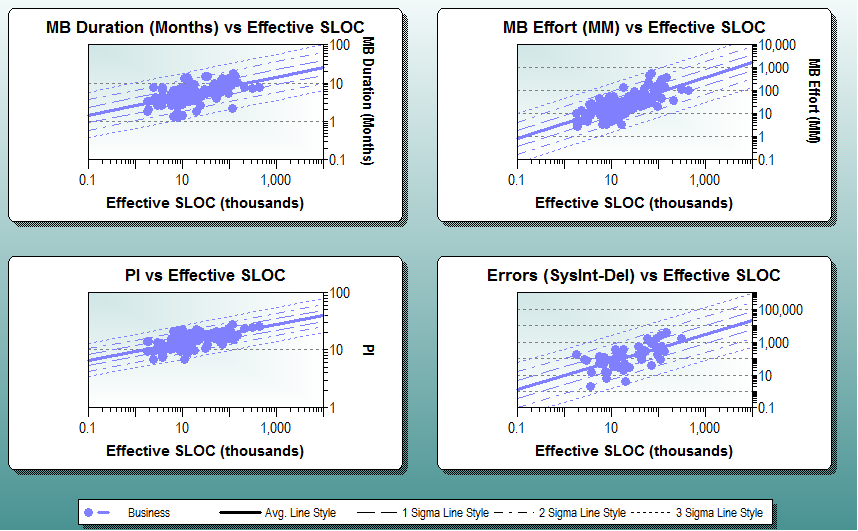
Software size has a big impact on metrics like effort, duration, defects, or productivity. We have known for many years that the relationship between project size and most software metrics is exponential. That is why our trends appear straight on a log – log scale.  SLIM Suite tools take project size into account by regressing core software metrics like effort, duration, or productivity against size to sanity-check estimates and benchmark completed projects:

SLIM standard deviation trend lines

The charts above show both the average trend and +/- 1, 2, and 3 standard deviation trend lines.  As a rule of thumb, a normal distribution (or one that has been normalized by transformation such as our log scale) will typically contain 68% of the data between +/- 1 standard deviation of the mean, 95% within +/- 2 standard deviations, and 99.7% within +/- 3 standard deviations.

Information about the standard deviation can be useful when analyzing software metrics, and it is quite easy to produce in SLIM-Metrics. Starting with a database of SLIM-DataManager projects, you can get a table of the standard deviations using SLIM-Metrics’ five star reports.

Here is a five star report for a set of Command & Control (C&C) software projects.

Blog Post Categories 
SLIM-Metrics Tips & Tricks

Demand the (Right) Right Data with SLIM-DataManager

A few weeks ago, Thomas C. Redman posted Demand the (Right) Right Data on the Harvard Business Review blog, about how managers should set the bar higher, in terms of data.

Why are managers so tolerant of poor quality data? One important reason, it seems to me, is that most managers simply don't know that they can expect better!  They've dealt with bad data their entire careers and come to accept that checking and rechecking the "facts," fixing errors, and accommodating the uncertainties that using data one doesn't fully trust are the manager's lot in life.

Although Redman suggests that managers should demand higher quality data, I immediately thought about how to check the quality of SLIM-DataManager databases using the Validate function and SLIM-Metrics.

If you're using SLIM-DataManager to create your own historical database, you can use the Validation feature to help you demand the (right) right data.  The Validation feature in SLIM-DataManager analyzes the projects in your database, highlights suspect projects, and offers a brief explanation tool tip.  Simply go to File|Maintenance|Validate to run this feature and wait for SLIM-DataManager to analyze your database.  If SLIM-DataManager detects anomalies, it will highlight that project in blue.  If you hover over that project, a tooltip will explain what is wrong with that project data and what you need to take a second look at.

Tuning Effort for Best in Class Analysis and Design

After reading Best Projects/Worst Projects in the QSM IT Almanac, a SLIM-Estimate® user noted that the Best in Class Projects expended around 28% of their total project effort in analysis and design (SLIM Phase II) compared to 10% for the Worst in Class Projects. She wanted to know how she could tune her SLIM-Estimate templates to build in the typical best in class standard for Analysis and Design.

In SLIM-Estimate, effort and duration for phases I and II are calculated as a percentage of Phase III time and effort. To create a template for estimating phases II and III that will automatically allocate 28% of total project effort to analysis and design (Phase II), follow these simple steps.

  • From the Estimate menu, select Solution Assumptions.  Make sure the “Include” check boxes for Phases II and III are selected.  Then click on the Phase Tuning tab.
  • Click on the tab for Phase II.  (If you have previously customized the phase names, the default name for Phase II will reflect that).
  • Click on the Manual button under Effort, and enter 28% for the effort percent.

That’s it. Your estimates based on this template will now automatically allocate 28% of total project effort to Analysis and Design (Phase II).

This procedure assumes that your estimates will be for SLIM Phases II and III, which, we have found, is the typical scope for most project estimates. However, if your estimates include Phases I and/or IV, you may have to increase the effort percent a bit to achieve the desired result.

Blog Post Categories 
SLIM-Estimate Tips & Tricks Effort

SLIM Suite Quick Reference Guide

Have you ever found yourself wondering which SLIM tool to use for a task, or what interfacing features are available for various SLIM Suite applications? We've created a handy Quick Reference Guide that offers a concise, "at a glance" summary of the great features built into SLIM Suite! This one page table is chock full of useful information about import/export capabilities, major tool features, and interfaces to other SLIM tools or applications like Microsoft Project and IBM Rational Focal Point and Rational Team Concert.

Here's what you'll find:

  • Tool descriptions and features
  • Workbook extensions for each application
  • API (Application Programmer's Interface) and third party integration availability by application
  • Which settings and data can be imported into each tool
  • Export options for charts, reports, and project data

Whether you've licensed one or two applications or the entire tool suite, we hope our Quick Reference Guide will be a helpful resource. 

You can find more resources in the QSM Support section of our website.

Blog Post Categories 
Tips & Tricks Quick Reference

Two Tools Are Better Than One

Have you ever been excited to discover a new use for something familiar, like learning that lighter fluid can be used to remove ink stains from your clothes?  I recently discovered a way to leverage the tie between SLIM-Estimate and SLIM-DataManager that I was previously unaware of.  

My limited view of SLIM-DataManager as a tool for historical data and SLIM-Estimate as a tool for software project estimation limited my creativity in applying the rich set of capabilities in the entire SLIM tools suite.  I recently observed a more experienced SLIM user use both tools to model a history project where very little data was available, using both applications.  Here is a description of the situation.

Scenario: 

You have gathered metrics from a completed project to serve as the basis of estimation for your next project.  Software size, lifecycle effort, lifecycle duration (phases 1-3), and defects are known, but you do not have a break out of individual phase data.  How can you best model this project and capture the results in SLIM-DataManager?

Solution A: 

Blog Post Categories 
Estimation Tips & Tricks